
Altcoin Playbook 2026: Analyzing Wallets, LP, and Holder Concentration
Master the fundamentals of on-chain analysis in 2026. Learn how to evaluate wallet clusters, liquidity pool health, and holder concentration for altcoins.

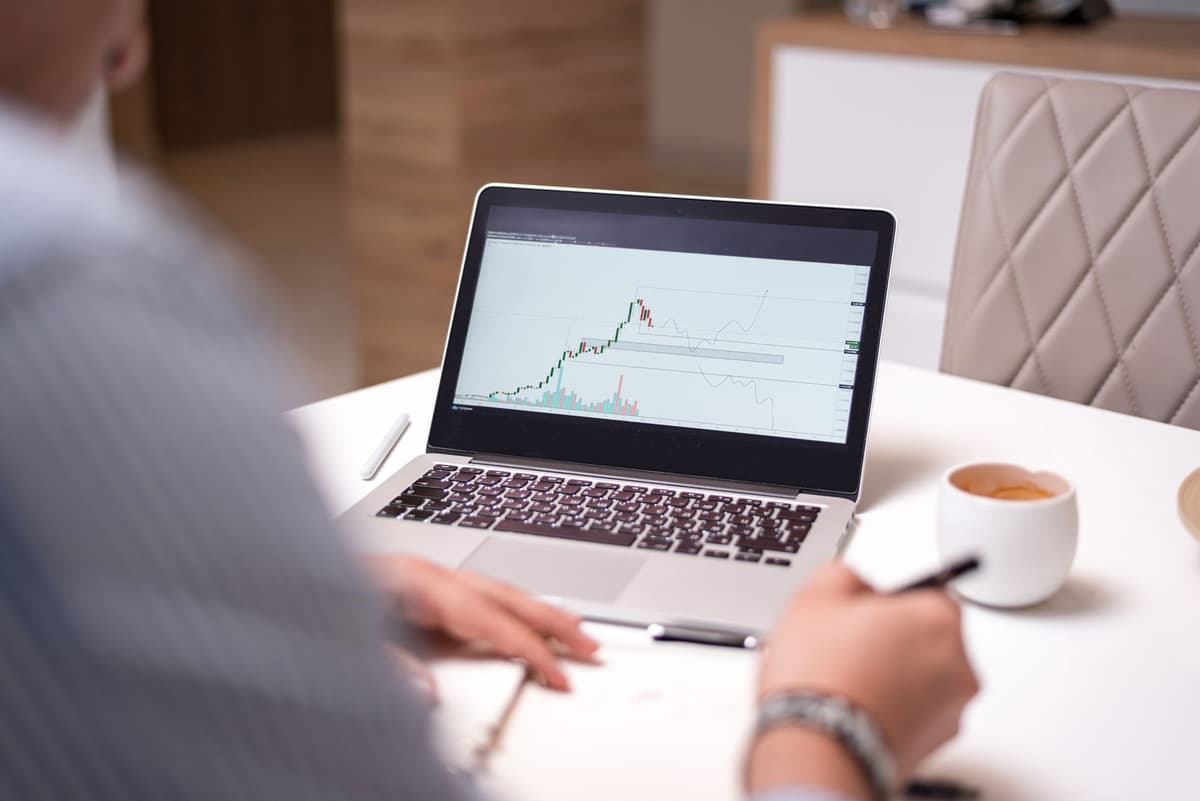
Analyzing altcoin health requires a systematic verification of wallet distribution, liquidity pool stability, and on-chain behavioral clustering. By utilizing blockchain explorers and portfolio trackers, market participants can identify institutional movements and concentration risks before significant market shifts occur.
The Anatomy of On-Chain Analysis
In 2026, the complexity of the altcoin market demands a disciplined approach to data. Relying on price action alone is insufficient; you must look at the structural integrity of the token contract and the composition of its holders. This is not financial advice, and this is not a buy signal.
1. Evaluating Holder Concentration
Holder concentration is the primary indicator of potential price manipulation or 'rug' risk. If a small cluster of wallets controls a significant percentage of the circulating supply, the asset remains vulnerable to sudden liquidity drains.
1. Identify the top 10 holders using a block explorer.
2. Check if the top addresses are contract addresses, exchange hot wallets, or private individual wallets.
3. Monitor for 'behavioral clustering,' where multiple wallets move funds in unison, suggesting a single entity controlling multiple accounts.
If the top 10 holders control more than 60% of the supply, the token is highly centralized. This creates a scenario where the sell-side pressure can overwhelm the liquidity pool instantly.
2. Liquidity Pool (LP) Mechanics
Liquidity is the lifeblood of any altcoin. Without sufficient depth in the pool, every trade creates outsized slippage. In 2026, we look beyond just the total value locked (TVL).
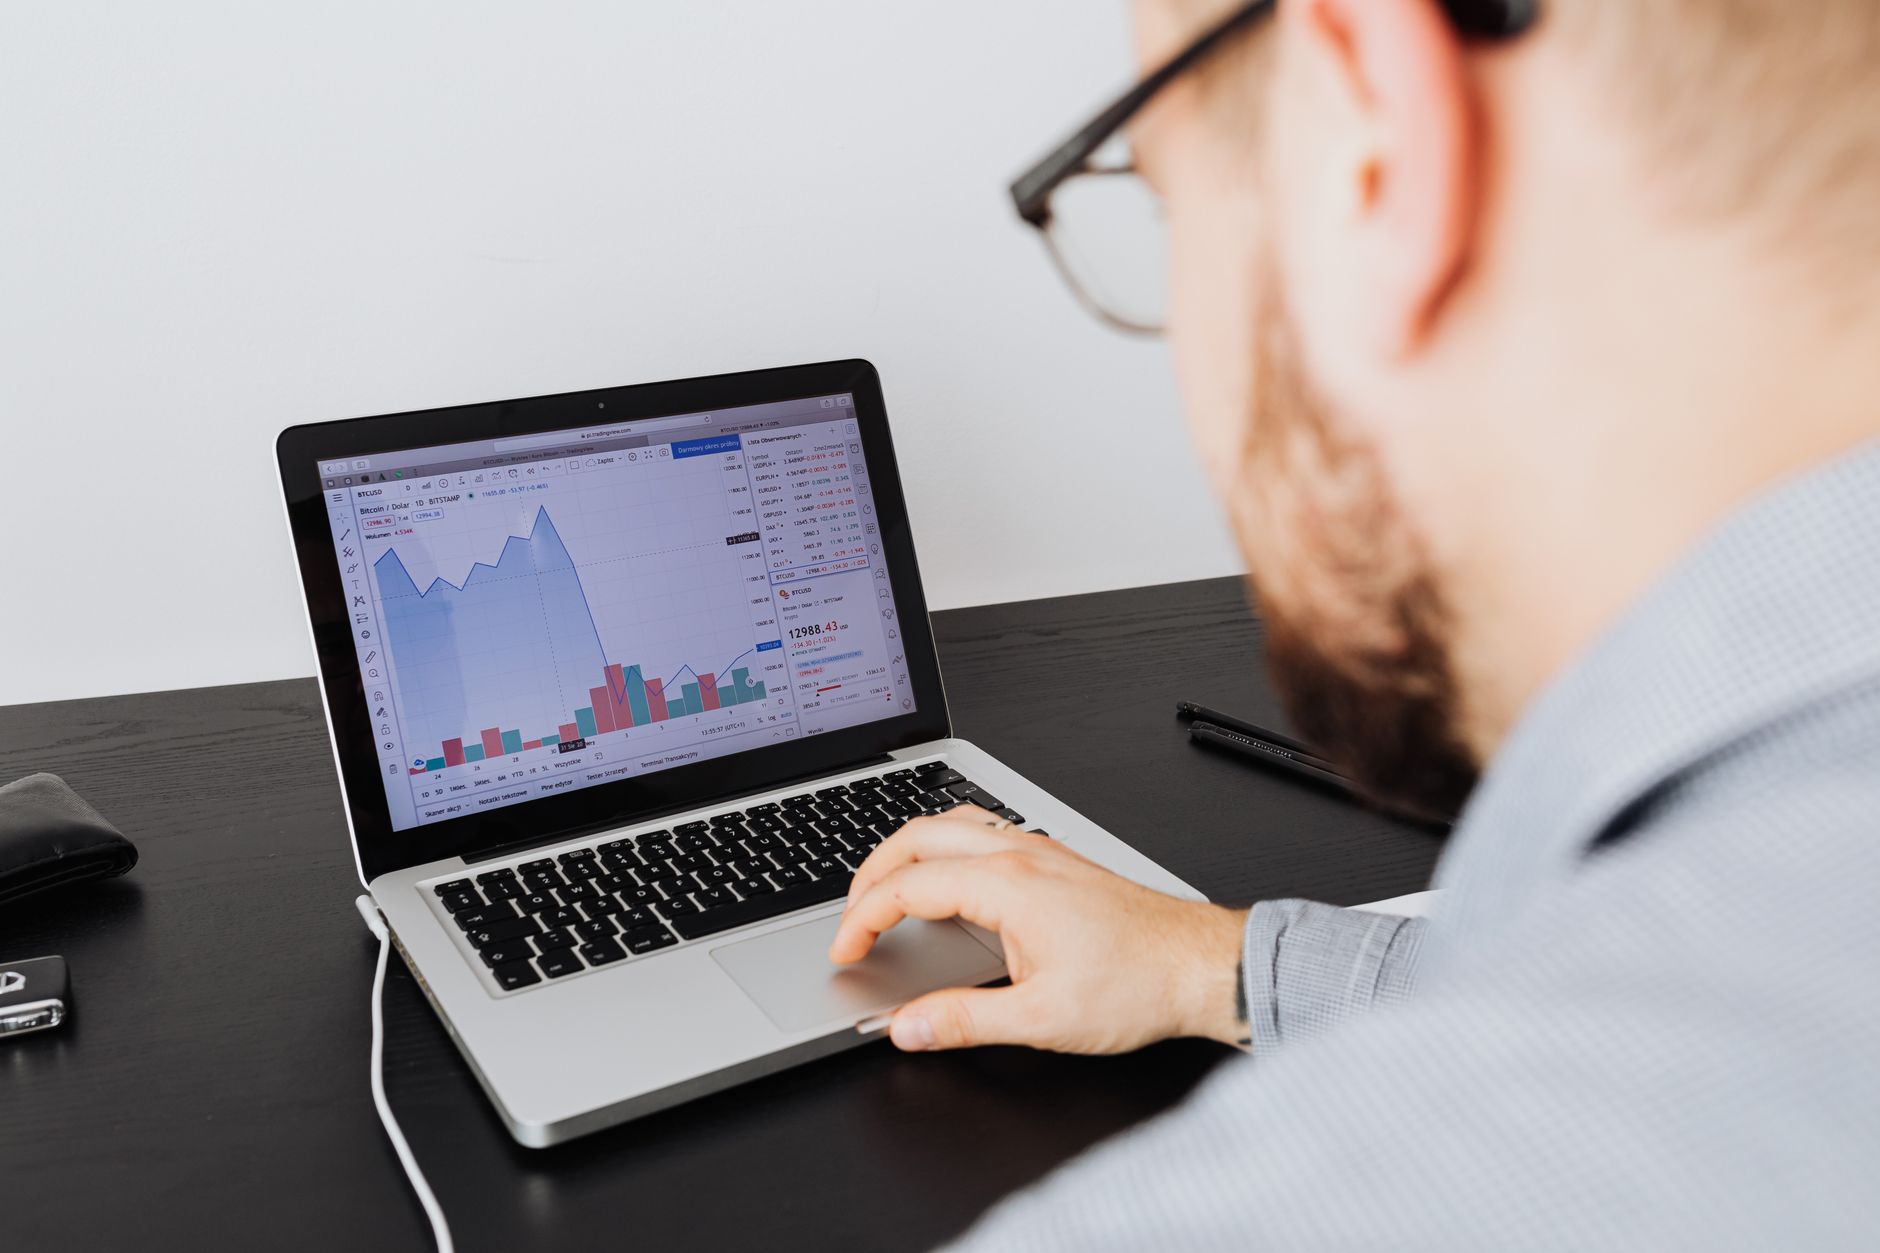
- Verify if the liquidity is 'locked' or 'burned.' This prevents the deployer from withdrawing the base assets, which is a common exit strategy in low-cap assets.
- Analyze the ratio of the base asset (e.g., SOL) to the token in the pool.
- Observe the volume-to-liquidity ratio; if volume is high but liquidity is thin, the price action is likely artificial or highly volatile.
3. Monitoring Whale and Institutional Activity
Whales often leave a distinct footprint. While retail participants react to news, whales move based on accumulated data. Modern intelligence terminals and portfolio dashboards allow you to track these 'smart money' addresses.
- Filter for large transactions that occur outside of typical retail hours.
- Cross-reference large inflows into decentralized exchanges with corresponding outflows from centralized exchange wallets.
- Identify consistent accumulation patterns that precede periods of high volatility.
FAQ
What is the biggest risk when analyzing wallet concentration?
The biggest risk is misinterpreting exchange-owned wallets as individual whale holdings, which leads to skewed data regarding true decentralization.
How can I tell if a liquidity pool is being manipulated?
Look for 'wash trading' indicators, such as high-frequency swaps between the same two addresses that generate volume without shifting the actual price significantly.
Maintaining a Sober Framework
Every interaction on-chain is a permanent record. Whether you are using a portfolio tracker to monitor your positions or a block explorer to audit a contract, the goal is to filter out noise.
| Metric | Importance | Action |
|---|---|---|
| Holder Count | Medium | Check for growth trends |
| Liquidity Depth | High | Ensure minimal slippage |
| Top 10 Concentration | Critical | Audit for centralization risk |
| Whale Inflows | High | Monitor for institutional moves |
By focusing on these structural elements, you build a clearer picture of the token's ecosystem. Stay objective, verify the data yourself, and always prioritize risk management over speculative potential.
Related posts in On-Chain & Whale Tracking
- On-Chain & Whale Tracking
Decoding Bonding Curve Metrics: A 2026 Guide to On-Chain Memecoin Analysis
Master the art of reading bonding curve metrics on Solana. Learn to identify whale accumulation, liquidity health, and migration readiness before price moves.
Memelogs
- On-Chain & Whale Tracking
Decoding Bonding Curve Metrics: A 2026 Guide to Solana Memecoin Analysis
Master the art of reading bonding curve metrics before a memecoin moves. Learn how to track whale activity, liquidity shifts, and migration risks on Solana.
Memelogs
- On-Chain & Whale Tracking
On-Chain Red Flags: How to Spot Solana Rugpulls in 2026
Learn to identify common Solana rugpull patterns in 2026. Master on-chain checks for liquidity, wallet concentration, and contract risks before you participate.
Memelogs