
Decoding Bonding Curve Metrics: A 2026 Guide to Solana Memecoin Analysis
Master the art of reading bonding curve metrics before a memecoin moves. Learn how to track whale activity, liquidity shifts, and migration risks on Solana.

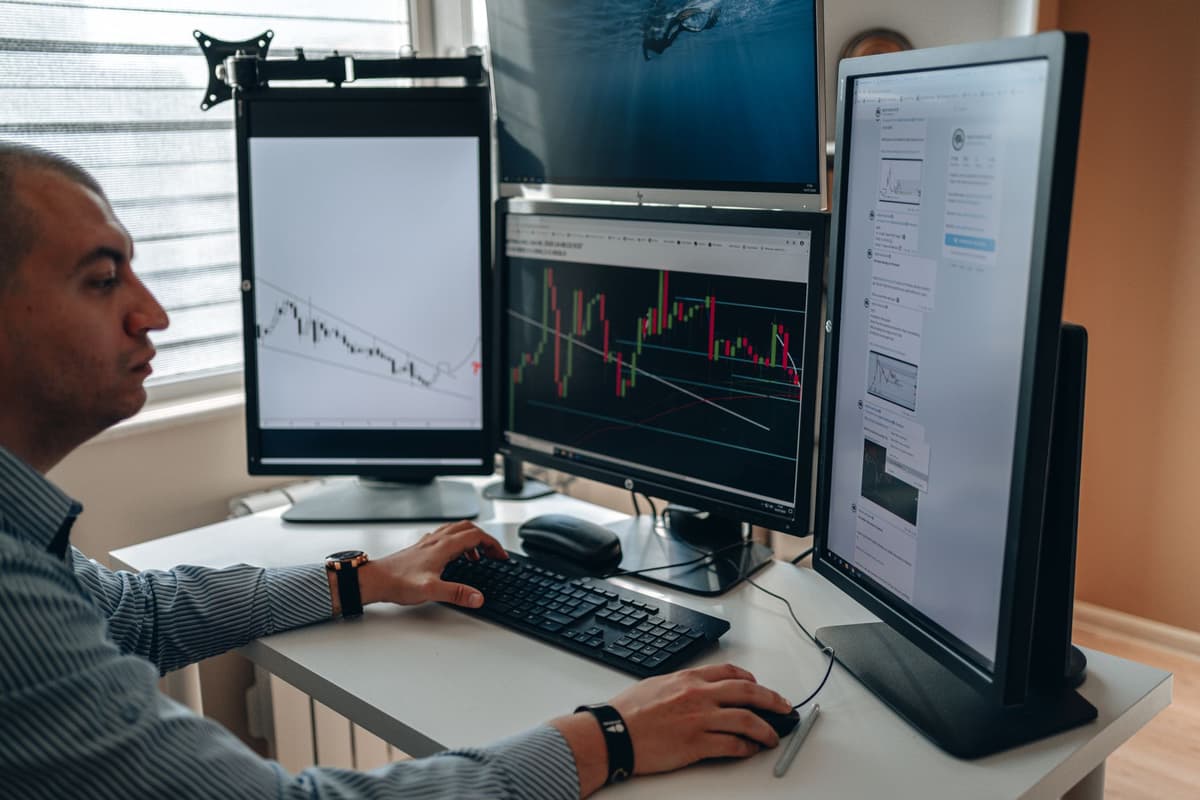
Bonding curve metrics provide a transparent look at the lifecycle of a memecoin before it migrates to a decentralized exchange. By analyzing the graduation percentage, early-buyer concentration, and liquidity growth, participants can assess the risk of a token failing or succeeding during its transition from a launchpad to a live liquidity pool.
Understanding the Bonding Curve Lifecycle
In 2026, the memecoin market on Solana is defined by high-frequency launches and rapid migrations. A bonding curve functions as a mathematical price discovery mechanism. As buyers purchase tokens, the price increases along a predictable curve until a specific threshold is met, triggering the migration to a decentralized exchange like Raydium or Meteora.
Understanding this phase is critical because the bonding curve determines the initial distribution of supply. If early buyers hold too much of the supply, the risk of a massive sell-off post-migration increases significantly. This is not financial advice, and these metrics are not buy signals.
How to Audit Bonding Curve Data

1. Analyze the Graduation Progress
Track how close the token is to hitting its migration target. A token that moves slowly is often ignored by the market, while one that surges through the curve might indicate coordinated buying. Use block explorers to see if the volume is organic or concentrated in a few wallets.
2. Inspect Holder Concentration
Before the migration, look at the top 50 holder wallets. If a small cluster of addresses owns a significant portion of the circulating supply, the token is at high risk of manipulation. A healthy distribution suggests wider community interest, which is often a better precursor to sustained volume post-migration.
3. Monitor Migration Readiness
Once a token reaches its bonding curve limit, it moves to the 'final stretch' phase. During this time, observe the liquidity pool creation. Check if the liquidity is burned or locked, as this prevents the developer from pulling the rug immediately after the token goes live on a standard exchange.
Key Metrics for On-Chain Assessment
| Metric | Significance | Danger Sign |
|---|---|---|
| Holder Count | Measures community size | Low count with high supply concentration |
| DEX Volume | Tracks liquidity interest | Sudden, unexplained spikes followed by dead silence |
| Migration Status | Shows transition phase | Failed or stalled migration progress |
| Wallet Clusters | Identifies buyer types | Multiple wallets buying at the same timestamp |
Identifying High-Risk Patterns
Many participants fail to account for 'coordinated buying.' This occurs when a group of wallets purchases tokens simultaneously to push the price toward the bonding curve limit. Once the migration occurs and liquidity is added, these wallets often exit their positions, leaving retail participants with 'heavy bags.'
Always look for tokens where the volume is steady rather than sporadic. Rapid, vertical spikes in volume on a bonding curve launchpad without a corresponding increase in active wallet counts are often indicators of bot activity or wash trading designed to lure in liquidity.
FAQ with On-Chain Insights
What does it mean when a token graduates from a bonding curve?
When a token graduates, it finishes its initial sale phase on a launchpad. The remaining supply and the accumulated SOL are moved to a decentralized exchange to form a permanent liquidity pool. This turns the token into a tradable asset that is no longer restricted by the bonding curve's price formula.
Why is whale tracking essential during the bonding phase?
Whales often attempt to accumulate a large percentage of supply at the lowest possible price point on the bonding curve. By tracking these wallets, you can identify if 'insider' or 'early' accumulation is occurring, which often dictates the price action once the token migrates and becomes accessible to the broader market.
Related posts in On-Chain & Whale Tracking
- On-Chain & Whale Tracking
Decoding Bonding Curve Metrics: A 2026 Guide to On-Chain Memecoin Analysis
Master the art of reading bonding curve metrics on Solana. Learn to identify whale accumulation, liquidity health, and migration readiness before price moves.
Memelogs
- On-Chain & Whale Tracking
On-Chain Red Flags: How to Spot Solana Rugpulls in 2026
Learn to identify common Solana rugpull patterns in 2026. Master on-chain checks for liquidity, wallet concentration, and contract risks before you participate.
Memelogs
- On-Chain & Whale Tracking
Accumulation 2026: Tracking Whale Movements on Solana Before Narratives Heat Up
Learn to identify early whale accumulation patterns on-chain. Master the steps to track fresh wallets and liquidity shifts before market narratives take hold.