
Altcoin Playbook 2026: Analyzing Wallets, Liquidity, and Concentration
Master the fundamentals of on-chain analysis in 2026. Learn to evaluate wallet clusters, LP depth, and holder concentration to refine your market research.

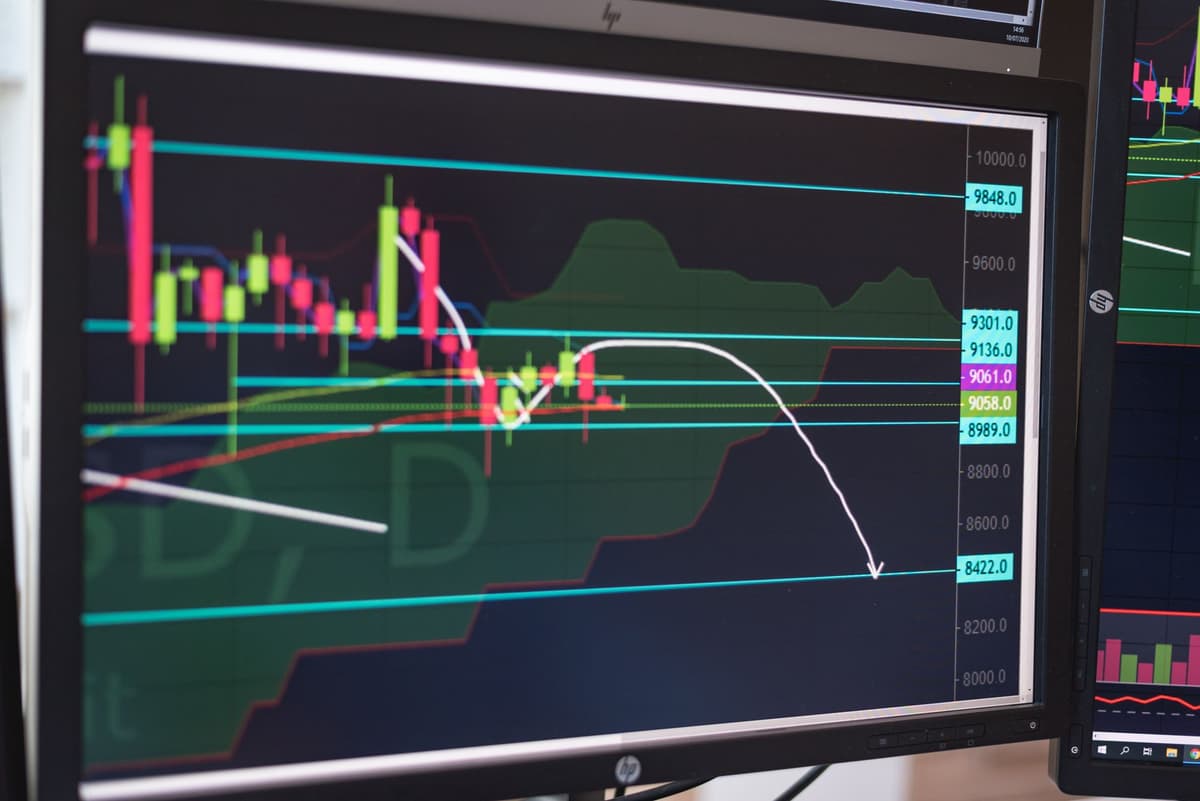
Effective on-chain analysis requires evaluating the distribution of tokens among top holders, the depth of liquidity pools, and the movement of large-scale capital. By auditing these metrics on block explorers, participants can identify structural risks such as extreme holder concentration or insufficient exit liquidity before making decisions.
The Anatomy of On-Chain Due Diligence
In the current market cycle, the sheer volume of activity on high-throughput networks like Solana demands a disciplined approach to data. Raw transaction counts often mask underlying structural weaknesses. To navigate this landscape, you must move beyond price action and analyze the mechanical reality of the assets you monitor.
Understanding Holder Concentration
One of the most critical red flags in any token project is a lack of supply distribution. When a small cohort of wallets controls a significant portion of the total supply, the asset is susceptible to artificial price manipulation and coordinated exit events.
- Check the top 10 holders via the chain-specific block explorer.
- If top wallets hold 60% or more of the supply, the project is highly centralized.
- Look for "burn" addresses or locked contract addresses that account for a large percentage of supply; these should be excluded from your concentration analysis.
Liquidity Pool (LP) Integrity
Liquidity is the lifeblood of any altcoin. If an asset has high volume but low liquidity, even modest sell orders can cause drastic price slippage. You must verify that the liquidity is not only present but also inaccessible to the developers.
1. Verify LP Lock Status
Check if the liquidity provider tokens are sent to a null address or a recognized locking contract. If the liquidity can be withdrawn at any time by the deployer, the risk of a rug pull remains.
2. Assess Liquidity Depth
Evaluate the amount of stablecoin or base-asset pairs locked in the pool. A thin pool against a volatile pair indicates that the asset is highly susceptible to price volatility regardless of its market capitalization.
3. Monitor LP Migration
Observe if liquidity is being migrated or drained in pieces. Frequent, small withdrawals from an LP are often a precursor to a total liquidity removal event.
Whale Tracking and Cluster Analysis
Tracking "smart money" involves identifying patterns rather than blindly mimicking trades. Large investors often distribute their holdings across multiple wallets to minimize their market footprint.
- Use explorer tools to identify wallets that consistently interact with new protocols early.
- Observe if these wallets move assets to centralized exchanges, which often signals an intent to divest.
- Look for clusters of wallets that move in unison; this suggests a singular entity or a small team controlling multiple addresses to simulate organic volume.
Practical Steps for Market Research
- Search for the token contract address on the chain's primary block explorer.
- Navigate to the "Holders" or "Token Distribution" tab to visualize the percentage held by the top 10 and top 50 addresses.
- Verify the percentage of supply that is currently locked in decentralized finance protocols versus held in personal wallets.
- Examine the "Transactions" or "DEX Trades" tab to see if the largest holders are currently accumulating or distributing.
- Cross-reference these findings with general market sentiment to see if price action aligns with the actual movement of tokens on-chain.
FAQ
What constitutes a "red flag" in holder concentration?
A token where the top 10 wallets hold 60% or more of the total supply is generally considered highly concentrated. In such cases, the price is often dictated by the behavior of a few individuals rather than broad market demand.
Why is on-chain activity sometimes misleading?
Raw transaction counts can be inflated by automated bots or wash trading. It is essential to look at the unique wallet count and the actual movement of value, rather than just the number of transactions per second.
What this is NOT
This information is not financial advice, nor is it a buy signal. Market analysis involves significant risk, and historical performance or on-chain data does not guarantee future results. Always perform your own research and manage your risk exposure accordingly.
Related posts in On-Chain & Whale Tracking
- On-Chain & Whale Tracking
Decoding Bonding Curve Metrics: A 2026 Guide to On-Chain Memecoin Analysis
Master the art of reading bonding curve metrics on Solana. Learn to identify whale accumulation, liquidity health, and migration readiness before price moves.
Memelogs
- On-Chain & Whale Tracking
Decoding Bonding Curve Metrics: A 2026 Guide to Solana Memecoin Analysis
Master the art of reading bonding curve metrics before a memecoin moves. Learn how to track whale activity, liquidity shifts, and migration risks on Solana.
Memelogs
- On-Chain & Whale Tracking
On-Chain Red Flags: How to Spot Solana Rugpulls in 2026
Learn to identify common Solana rugpull patterns in 2026. Master on-chain checks for liquidity, wallet concentration, and contract risks before you participate.
Memelogs