
Solana Liquidity Migration: Tracking Whale Patterns on Raydium and Jupiter in 2026
Master the art of tracking liquidity migrations on Solana. Learn how to monitor whale wallets, Raydium pools, and Jupiter routing to identify market shifts.

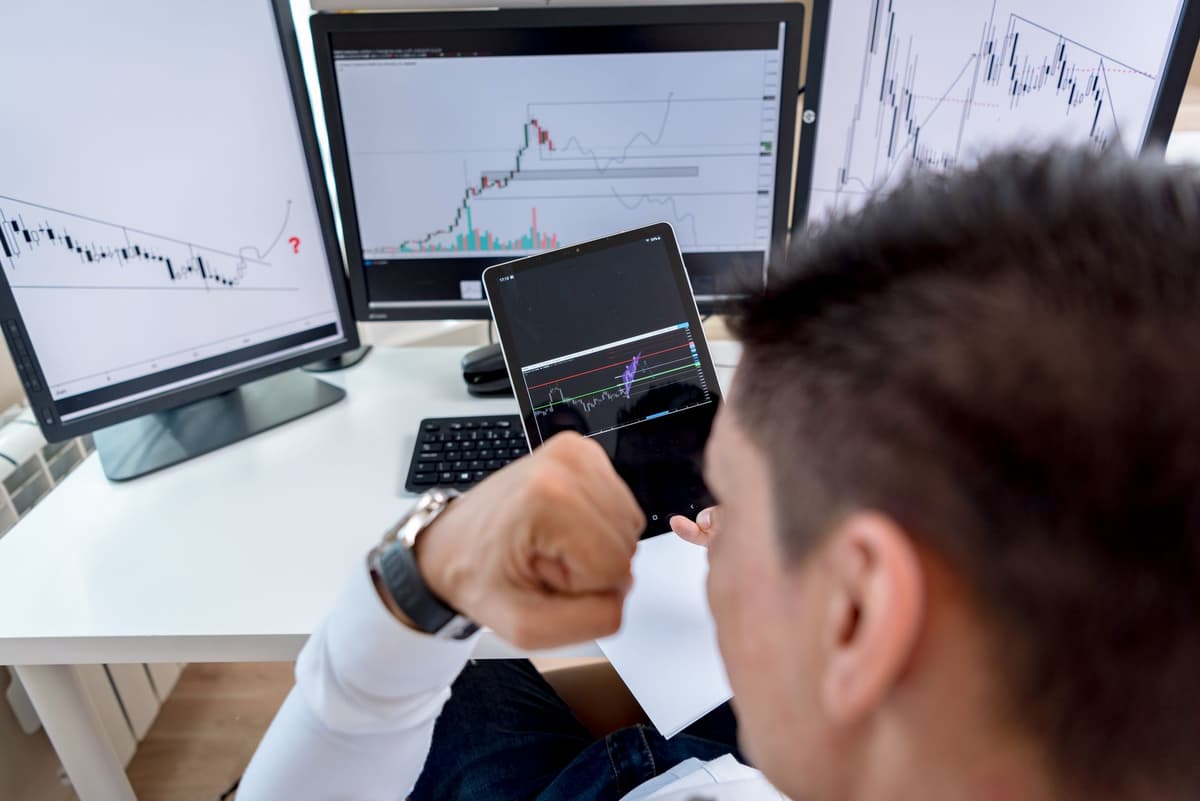
Liquidity migration on Solana is identified by observing consistent capital movement from decentralized pools into stable assets or across different liquidity providers like Raydium and Jupiter. By monitoring whale wallet clusters for scaling patterns or partial exits, market participants can observe shifts in sentiment before they become broad market trends.
Understanding Liquidity Flow
In the 2026 Solana ecosystem, liquidity is rarely static. It moves based on yield opportunities, protocol incentives, and whale confidence. As an observer, your goal is to map these movements rather than chase individual price spikes. Using on-chain data, you can distinguish between organic growth and temporary liquidity injections.
The Mechanics of Migration
Liquidity often migrates when large holders rebalance their portfolios. On Solana, this is visible through the interaction between liquidity aggregators and automated market makers. When a significant portion of liquidity moves, it often signals a change in the underlying asset's risk profile.
1. Monitor Whale Cluster Activity
- Identify whale addresses that consistently interact with high-volume liquidity pools.
- Observe if these wallets are accumulating a specific token across multiple transactions.
- Check if the wallet is scaling its position size slowly over several days rather than a single massive buy.
- Log whether the wallet is buying into price weakness; this often indicates a higher conviction than buying into upward momentum.
2. Identify Bearish Migration Patterns
- Look for large, partial exits from liquidity pools that were previously active.
- Verify if the tokens are being moved to centralized exchange deposit addresses, which often precedes a sell-off.
- Monitor for a sudden decline in daily activity from a wallet that was previously highly active.
- Note that a single trade is rarely a signal; look for the repetition of these behaviors over a weekly timeframe.
Analyzing Aggregator Routing
Jupiter remains the primary entry point for liquidity on Solana. Because it routes trades across various decentralized exchanges, you can use its data to see where the bulk of the volume is settling. If you notice a consistent routing preference toward newer or specific pools, it may indicate a migration of interest by smart capital. Raydium continues to hold the majority of the base liquidity, making it the primary point of reference for checking pool health and depth.
Practical On-Chain Checks
To effectively track these trends, you must look beyond the surface level of price charts. Use the following metrics to gauge the health of a pool:
| Metric | Purpose | Bullish Indicator |
|---|---|---|
| LP Depth | Measure pool stability | Increasing liquidity over time |
| Wallet Count | Measure token distribution | Steady growth in unique holders |
| Volume Consistency | Measure organic interest | Sustained volume without massive spikes |
FAQ
How can I tell if a whale exit is significant?
It is significant when the exit is partial, repeated across multiple wallets, and followed by a transfer to a centralized exchange address. Single, large trades are often just rebalancing, but consistent exits are patterns of distribution.
Does high volume on Jupiter always mean a token is healthy?
No. High volume can be indicative of rapid speculation or bot activity. Always cross-reference high volume with the movement of whale wallets and the stability of the underlying liquidity pool on Raydium to determine if the interest is structural or fleeting.
What this is NOT
This content is for educational purposes only. It is not financial advice, not a buy signal, and not a recommendation to engage in any specific trade. Always conduct your own research on-chain before making decisions.
Final Note on Observation
Patterns are the only reliable data point in a high-speed environment like Solana. By logging the behavior of identified whale clusters over weeks, you can filter out the noise of daily volatility. Focus on the migration of capital, not the migration of sentiment. If you cannot find clear patterns in a wallet’s history, do not force a conclusion. Sometimes, the most valuable observation is that the market is currently indecisive.
Related posts in On-Chain & Whale Tracking
- On-Chain & Whale Tracking
Decoding Bonding Curve Metrics: A 2026 Guide to On-Chain Memecoin Analysis
Master the art of reading bonding curve metrics on Solana. Learn to identify whale accumulation, liquidity health, and migration readiness before price moves.
Memelogs
- On-Chain & Whale Tracking
Decoding Bonding Curve Metrics: A 2026 Guide to Solana Memecoin Analysis
Master the art of reading bonding curve metrics before a memecoin moves. Learn how to track whale activity, liquidity shifts, and migration risks on Solana.
Memelogs
- On-Chain & Whale Tracking
On-Chain Red Flags: How to Spot Solana Rugpulls in 2026
Learn to identify common Solana rugpull patterns in 2026. Master on-chain checks for liquidity, wallet concentration, and contract risks before you participate.
Memelogs