
Solana Liquidity Migration: Tracking Capital Shifts in 2026
Master the art of tracking on-chain liquidity migration on Solana. Learn how to monitor whale movements and DEX volumes to understand market structure.

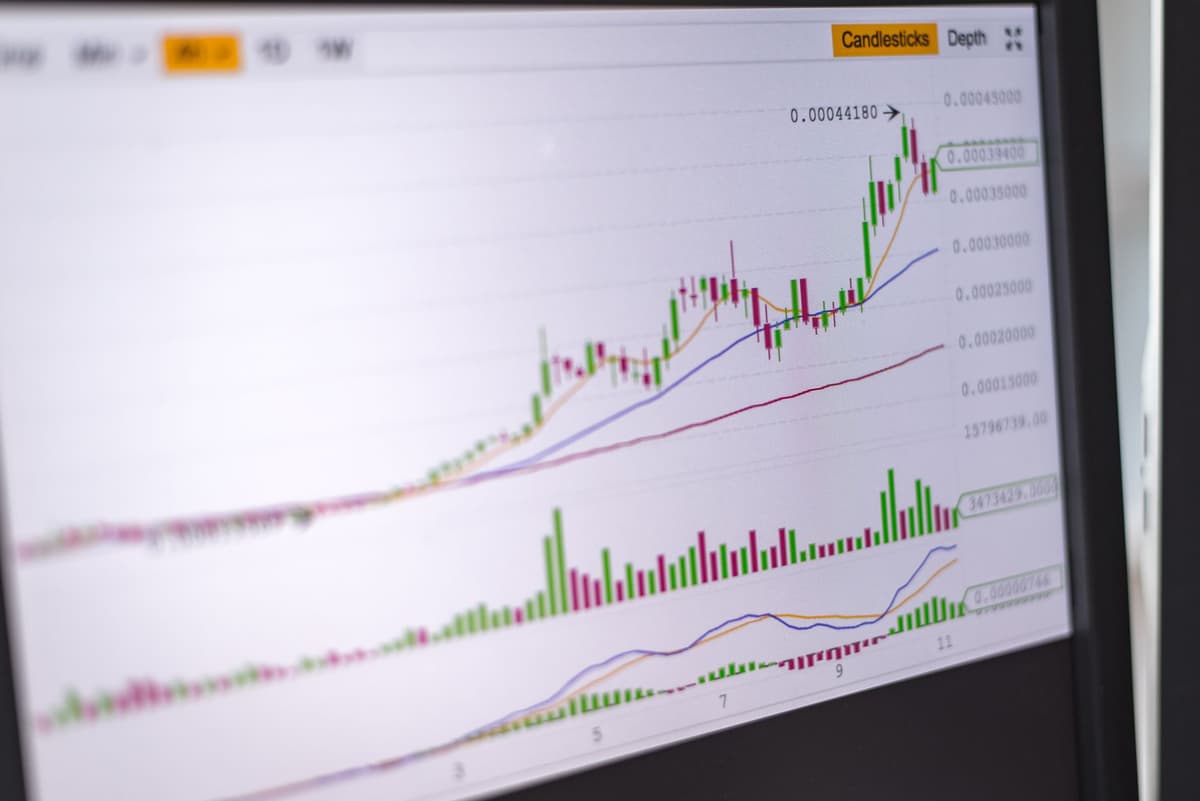
Liquidity migration on Solana in 2026 is identified by tracking shifts in stablecoin supply, institutional commitments to tokenized assets, and sustained daily volume on major aggregators like Jupiter. Market participants analyze these patterns by monitoring the relationship between declining TVL and organic transactional activity to distinguish between incentive-driven flows and genuine ecosystem growth.
Understanding Solana Liquidity Patterns
The Solana ecosystem has evolved significantly throughout 2026. As institutional interest shifts toward bank-grade infrastructure and tokenized assets—ranging from mortgages to gold—the way capital moves across decentralized exchanges has become more complex. For the astute observer, liquidity is no longer just about total value locked; it is about the quality and source of that capital.
Rising stablecoin supply on the network, particularly when paired with stable price action, serves as a primary indicator of demand. Conversely, when stablecoin supply contracts while the price of SOL experiences upward volatility, it often suggests a divergence that requires careful observation of on-chain behavior.
How to Track Liquidity Migration
To effectively monitor these shifts, you must look beyond surface-level metrics. Use block explorers and on-chain scanners to verify where the capital is flowing and who is driving the volume.
1. Analyze Stablecoin Supply
Check the net change in stablecoin supply on the Solana network on a weekly basis. A sustained increase in stablecoin liquidity typically indicates that participants are positioning themselves for deployment into DeFi protocols or asset-backed tokens.
2. Verify Aggregator Volume
Monitor daily volume on major aggregators. Sustained activity exceeding $1 billion per day is a strong indicator of organic transactional flow. If volume remains high during periods of lower volatility, it suggests that the activity is rooted in utility rather than speculative wash trading.
3. Monitor DePIN Sector Strength
Observe the price action of tokens within the Decentralized Physical Infrastructure Networks sector. When projects like Render, Helium, and io.net trend upward simultaneously, it often signals real-economy demand for Solana blockspace that exists independently of pure retail speculation.
4. Evaluate Incentive-Driven TVL
Total Value Locked is a lagging indicator. Compare TVL against transactional volume. A sharp decline in TVL, such as the one observed between late 2025 and mid-2026, often suggests that the previous liquidity was incentive-driven. When incentives fade, the remaining liquidity represents the true "sticky" capital that trusts the protocol's infrastructure.
Analyzing Whale and Institutional Commitments
Institutional players are increasingly integrating with Solana’s network for tokenized asset coverage. Tracking these "whales" involves looking for clusters of wallets interacting with lending protocols and yield-bearing infrastructure like Kamino.

- Look for wallet clusters that move large sums of stablecoins into lending vaults.
- Monitor the frequency of interaction with new tokenized asset pools.
- Distinguish between "mercenary" capital that exits after short-term yield farming and "strategic" capital that remains locked for long-term yield.
FAQ
What is the difference between organic volume and wash trading?
Organic volume is characterized by consistent, non-circular transactions that correlate with real-world activity, such as DePIN usage or stablecoin transfers. Wash trading often appears as high-frequency, repetitive volume between a limited set of wallets with no corresponding increase in unique active addresses or fee generation.
Why does TVL often decline even when the ecosystem is growing?
TVL is highly sensitive to token price and liquidity incentives. If a protocol reduces its reward emissions, liquidity providers often migrate to higher-yield opportunities elsewhere, causing a drop in TVL even if the underlying technology and user base of the project are expanding.
What this is NOT
This content is for educational purposes only. It is not financial advice, not a buy signal, and does not provide investment recommendations. All market participants should perform their own due diligence before interacting with any on-chain protocol.
Related posts in On-Chain & Whale Tracking
- On-Chain & Whale Tracking
Decoding Bonding Curve Metrics: A 2026 Guide to On-Chain Memecoin Analysis
Master the art of reading bonding curve metrics on Solana. Learn to identify whale accumulation, liquidity health, and migration readiness before price moves.
Memelogs
- On-Chain & Whale Tracking
Decoding Bonding Curve Metrics: A 2026 Guide to Solana Memecoin Analysis
Master the art of reading bonding curve metrics before a memecoin moves. Learn how to track whale activity, liquidity shifts, and migration risks on Solana.
Memelogs
- On-Chain & Whale Tracking
On-Chain Red Flags: How to Spot Solana Rugpulls in 2026
Learn to identify common Solana rugpull patterns in 2026. Master on-chain checks for liquidity, wallet concentration, and contract risks before you participate.
Memelogs