
Reading Solana Bonding Curve Metrics: A 2026 On-Chain Analysis Framework
Master the art of reading bonding curve metrics on Solana. Learn to identify whale clusters, liquidity health, and migration readiness without the hype.

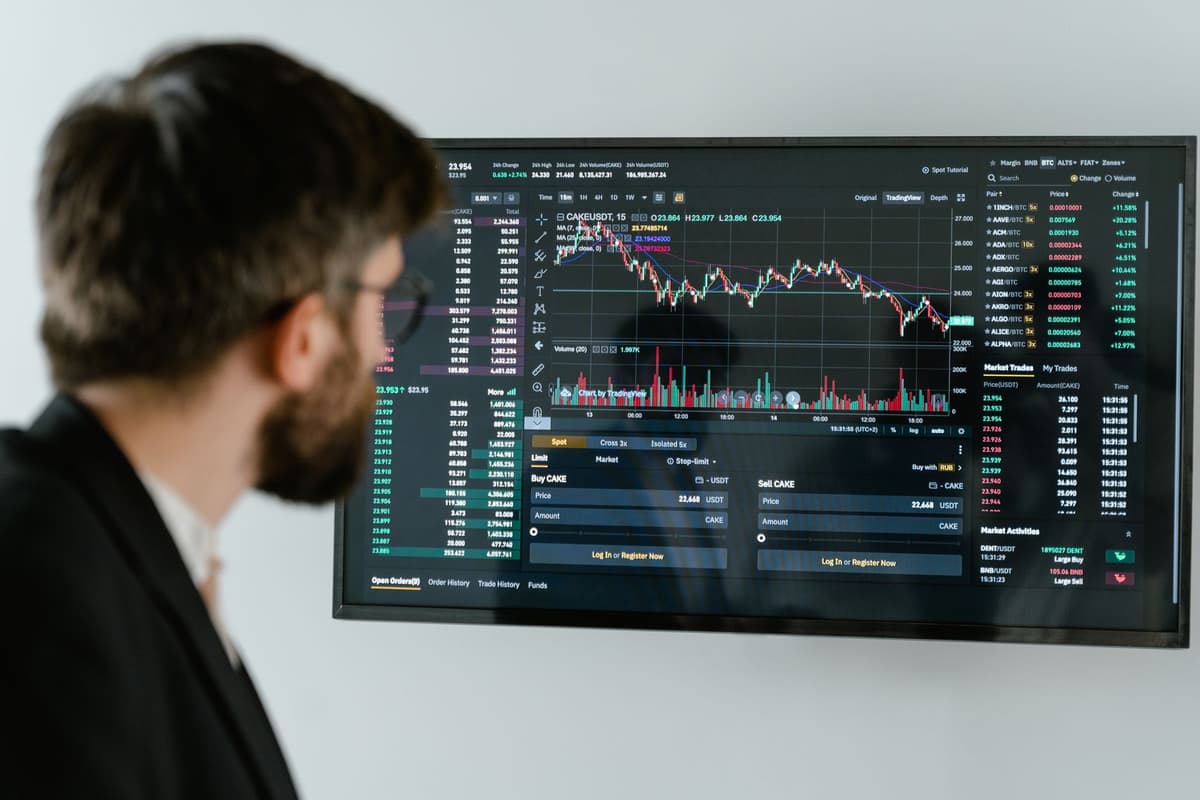
Reading bonding curve metrics requires verifying the transition from automated pricing models to decentralized exchange liquidity. Successful analysis involves tracking wallet clusters, monitoring the progression toward graduation, and confirming the permanent burning of liquidity tokens to ensure market stability.
Understanding the Bonding Curve Lifecycle
In 2026, the Solana ecosystem continues to rely on bonding curves as the primary mechanism for fair-launch memecoin distribution. A bonding curve acts as an automated pricing model where the cost of a token increases linearly or exponentially as the total supply is purchased. This system is designed to prevent early-stage manipulation by eliminating private presales or team-allocated supply.
However, the vast majority of these tokens suffer from rapid value decay once they hit a broader market. The critical moment for any participant is the "graduation" phase, where the accumulated liquidity is moved from the curve to a decentralized exchange like Raydium. Understanding this transition is the difference between identifying a functional asset and holding a terminal position.

Analyzing On-Chain Metrics
To evaluate a token before it shifts market cap or graduates, you must look beyond the price chart. You are looking for signs of organic interest versus manufactured volume.
1. Identifying Whale Clusters
Use a block explorer to inspect the top 20 holders. You are looking for a high concentration of tokens held by a few wallets that were funded from the same source. If the top holders are all linked to a single cluster, the risk of a coordinated sell-off after graduation increases significantly.
2. Validating Liquidity Health
The bonding curve model dictates that as the market cap approaches the graduation threshold, a specific amount of liquidity is deposited into a liquidity pool. Check if the project documentation or the launchpad interface specifies that these liquidity tokens are burned. Permanent burning is the only way to ensure that the liquidity cannot be withdrawn by the deployer.
3. Monitoring Volume and Fees
Real volume is characterized by a high number of unique wallets interacting with the contract. If the volume is high but the number of unique participants is low, it suggests wash trading or automated "bundling" of transactions. Look for consistent, smaller buys rather than massive, singular blocks of transactions that push the market cap toward the graduation limit without organic community growth.
Comparison Table: Metric Indicators
| Metric | Healthy Sign | Red Flag |
| :--- | :--- | :--- |
| Holder Distribution | Diverse, many small wallets | High concentration in 1-3 wallets |
| Transaction Pattern | Consistent, varied sizes | Large, periodic bundled trades |
| Liquidity Status | Burned/Locked permanently | Withdrawals enabled post-launch |
| Volume Source | Distributed across many IPs | Concentrated in single clusters |
FAQ
What does it mean when a token graduates from a bonding curve?
Graduation occurs when a token reaches a specific market cap target on a launchpad. At this point, the liquidity collected during the bonding phase is automatically deposited into a decentralized exchange pool, and the bonding curve mechanism is disabled. This marks the transition from a controlled environment to an open market.
How can I tell if a memecoin is being manipulated by bots?
Look for transaction bundling. If you observe the transaction history and see a series of identical buys occurring in the same block or within milliseconds of each other, it is a sign of coordinated bot activity. High global fees paid relative to the market cap often indicate an attempt to force the token toward graduation prematurely.
The Reality of 2026 Market Dynamics
As we move deeper into 2026, the narrative surrounding Solana memecoins is shifting. While the infrastructure has improved, the risk of narrative fragility remains the greatest threat to any project. A token might have perfect on-chain metrics, but if the social sentiment or the specific meme-angle loses relevance, the liquidity will evaporate rapidly. Thinner liquidity pools relative to major tokens mean that sharp moves in both directions are the standard, not the exception.
Focus on the data, not the hype. If the contract does not show evidence of burned liquidity, or if the holder list is dominated by a single cluster, the structural risk is likely too high for standard participation. Always verify the status of the liquidity pool directly via the block explorer rather than relying on third-party front-ends.
What this is NOT: This content is not financial advice, does not constitute a buy signal, and does not guarantee any market outcomes. Memecoin trading involves extreme risk of total loss of capital.
Related posts in On-Chain & Whale Tracking
- On-Chain & Whale Tracking
Decoding Bonding Curve Metrics: A 2026 Guide to On-Chain Memecoin Analysis
Master the art of reading bonding curve metrics on Solana. Learn to identify whale accumulation, liquidity health, and migration readiness before price moves.
Memelogs
- On-Chain & Whale Tracking
Decoding Bonding Curve Metrics: A 2026 Guide to Solana Memecoin Analysis
Master the art of reading bonding curve metrics before a memecoin moves. Learn how to track whale activity, liquidity shifts, and migration risks on Solana.
Memelogs
- On-Chain & Whale Tracking
On-Chain Red Flags: How to Spot Solana Rugpulls in 2026
Learn to identify common Solana rugpull patterns in 2026. Master on-chain checks for liquidity, wallet concentration, and contract risks before you participate.
Memelogs