
Reading Bonding Curve Metrics: Analyzing Memecoin Growth in 2026
Master the art of reading on-chain bonding curve metrics. Learn how to evaluate liquidity, whale movements, and holder distribution for 2026 memecoins.

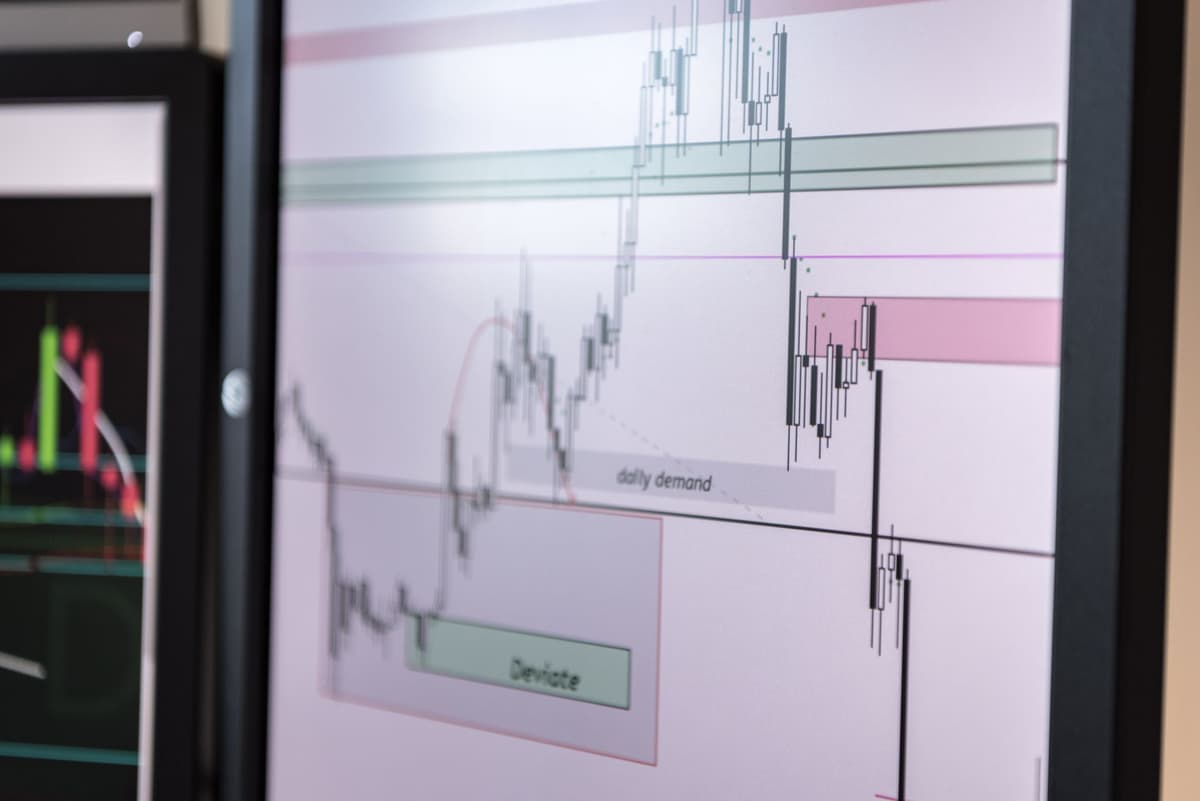
Reading bonding curve metrics involves monitoring the progression of a token's liquidity pool and holder concentration before it reaches a migration threshold. By tracking the ratio of buy-to-sell volume against the total supply locked in the curve, market participants can identify whether a token is gaining genuine traction or suffering from premature whale exhaustion.
Understanding the Bonding Curve
In the current 2026 landscape, the bonding curve acts as the primary mechanism for price discovery during the early life of a memecoin. Unlike established markets, the bonding curve is a mathematical function that determines the price based on supply. As tokens are purchased, the price increases along the curve, and liquidity is systematically added to the pool. Understanding this process is critical for anyone looking to analyze on-chain data effectively.
Why Liquidity Is the Foundation
Liquidity is the bedrock of every tradable asset. Without sufficient depth, the market becomes prone to extreme volatility where even modest transactions trigger massive price swings. Experienced market participants prioritize tokens that demonstrate a healthy progression toward a locked liquidity event.
Before engaging with a token, focus on these fundamental data points:
- Total liquidity size relative to market capitalization
- The presence of a verified liquidity lock duration
- Status of burned liquidity pool tokens
- Distribution of initial liquidity providers

1. Analyze Liquidity Integrity
A liquidity lock is a necessary safeguard that helps mitigate rug-pull risks. It prevents developers from withdrawing the base asset from the pool prematurely. Always verify that the liquidity tokens are either burned or sent to a multi-signature contract with a transparent time-lock.
2. Monitor Whale Wallet Clusters
On-chain analysis allows you to view the movement of capital in real-time. By utilizing a block explorer, you can identify if a few wallets hold a disproportionate percentage of the supply. If a small cluster of wallets controls a significant portion of the bonding curve progression, the risk of a sudden supply dump increases significantly as the price nears migration.
3. Evaluate Holder Distribution
High concentration is a red flag. Look for a healthy dispersion of tokens across many unique addresses. A token with a broad base of small holders is generally more resilient to market volatility than one dominated by five or ten massive wallets. Use an on-chain scanner to visualize the current holder distribution and identify if the top wallets are actively selling into the curve.
4. Track Volume vs.
Price Action
Monitor the volume-to-market-cap ratio. If the price is climbing rapidly but the volume is drying up, it often signals a lack of new interest. Conversely, consistent volume growth during the bonding phase suggests stronger community conviction. This is a vital metric to differentiate between organic growth and artificial price manipulation.
FAQ
What is the primary indicator of a healthy bonding curve?
A healthy bonding curve is characterized by steady, incremental volume growth and a diverse distribution of holders. When the liquidity pool grows proportionally to the market cap, it indicates a stable environment for potential migration to a decentralized exchange.
How can I detect if a developer is abandoning a token?
Look for evidence of liquidity withdrawal or the systematic offloading of tokens by the deployer wallet. If you observe the deployer wallet selling into the curve while simultaneously reducing their stake in the liquidity pool, this is a clear signal that the project's long-term viability is being compromised.
The Reality of 2026 Market Dynamics
Market participants must remain aware that the 2026 environment is characterized by significant volatility. Even with perfect data, the memecoin landscape remains speculative. The decline in broader market sentiment during early 2026 serves as a reminder that liquidity can vanish rapidly when external macroeconomic conditions shift. Always prioritize risk management over the pursuit of rapid gains.
What this is NOT: This content is not financial advice and does not constitute a buy signal. The metrics described are for analytical purposes only and do not guarantee favorable trading outcomes.
Related posts in On-Chain & Whale Tracking
- On-Chain & Whale Tracking
Decoding Bonding Curve Metrics: A 2026 Guide to On-Chain Memecoin Analysis
Master the art of reading bonding curve metrics on Solana. Learn to identify whale accumulation, liquidity health, and migration readiness before price moves.
Memelogs
- On-Chain & Whale Tracking
Decoding Bonding Curve Metrics: A 2026 Guide to Solana Memecoin Analysis
Master the art of reading bonding curve metrics before a memecoin moves. Learn how to track whale activity, liquidity shifts, and migration risks on Solana.
Memelogs
- On-Chain & Whale Tracking
On-Chain Red Flags: How to Spot Solana Rugpulls in 2026
Learn to identify common Solana rugpull patterns in 2026. Master on-chain checks for liquidity, wallet concentration, and contract risks before you participate.
Memelogs