
Solana Volatility 2026: Navigating the Institutional Squeeze and Narrative Shifts
Solana volatility is at a multi-year low. We break down the institutional floor, the $97 breakout threshold, and how to watch for narrative shifts tomorrow.

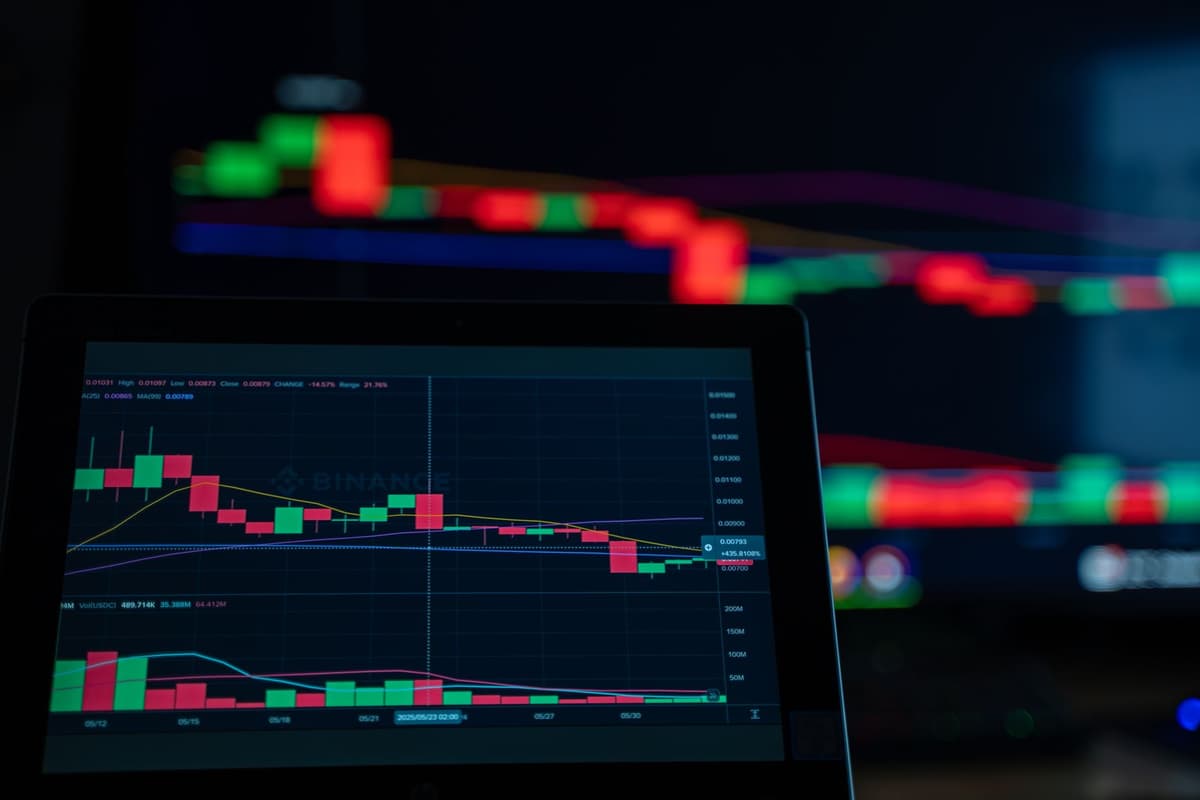
Solana is currently locked in a tight volatility squeeze between $77 and $88, with institutional activity providing a stable but low-velocity floor. A decisive breakout above $97 is required to shift the current range-bound sentiment toward a broader bullish trend in 2026. Market participants should monitor for volume spikes that signal a break from these narrow boundaries rather than assuming a continuation of the current stagnation.
The Narrative vs.
The Reality
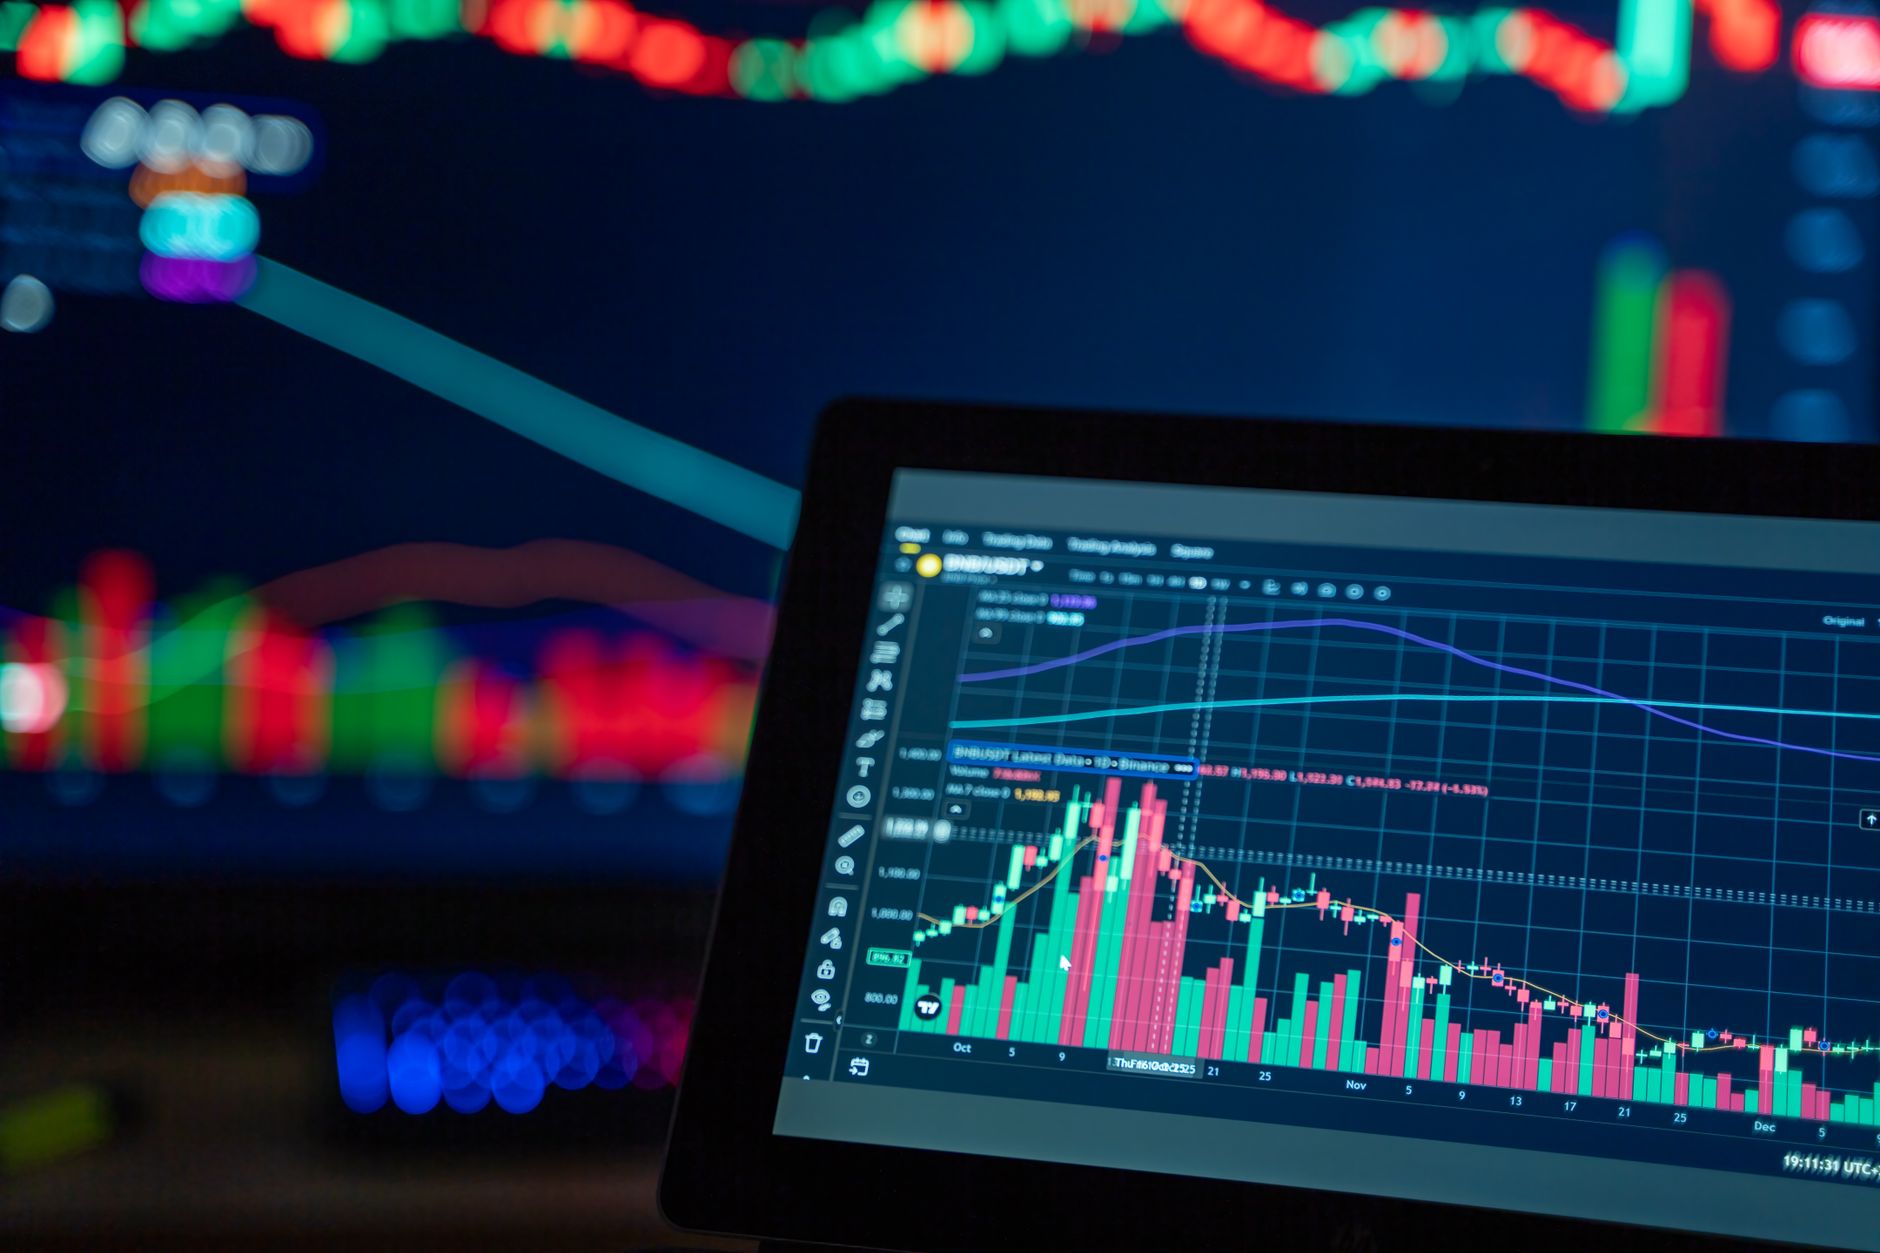
Today’s market sentiment regarding Solana feels like a classic case of "wait and see." The dominant theme on social timelines is the anticipation of a volatility explosion, fueled by the observation that Bollinger Bands have converged to levels not seen in years. The narrative suggests that because we are at a multi-year low in volatility, a massive expansion is imminent.
However, the on-chain data and volume profiles tell a more skeptical story. While the institutional trade has effectively created a floor around the $82 to $85 range, there is a glaring absence of high-velocity capital. The "institutional support" narrative is technically accurate—the assets in spot ETFs provide a buffer—but this stability is a double-edged sword. It has effectively suppressed the chaotic retail movement that usually drives rapid memecoin ecosystem expansion. We are seeing a market that is neither buying with conviction nor selling into the panic, leading to a liquidity trap where price action is perverted by the lack of genuine, high-conviction volume.
Market Mechanics: The Psychology of the Squeeze
It is easy to fall into the trap of believing that because a chart looks "coiled," it must spring. But remember that technical patterns are often lagging indicators of human behavior. When everyone is watching the same $88 resistance level, the market often performs a "liquidity sweep" to shake out participants before making a real move.
If you find yourself glued to the 1-minute charts waiting for a breakout, you are likely suffering from analysis paralysis. The reality of 2026 market dynamics is that liquidity is often fragmented. What shows up on your screen as a "breakout" might just be a localized event driven by a few participants adjusting positions, rather than a fundamental shift in the asset's trajectory.
FAQ
What is the significance of the $97 price level for Solana?
A sustained move above $97 is viewed as the necessary threshold to invalidate the current range-bound distribution and trigger a potential retest of higher resistance zones near $116 and beyond.
How does institutional activity affect current volatility?
Institutional holdings in spot products have created a stabilized floor, effectively dampening the high-velocity price swings typically seen in the memecoin market. This has resulted in a volatility squeeze, where price movement is confined within a tight range because neither institutional buyers nor retail participants are forcing a direction.
1. How to monitor the breakout
- Ignore the noise of social media sentiment and focus solely on volume confirmation during a breach of the $88 level.
- Observe if the move above $88 is accompanied by a sustained increase in transaction velocity, which would confirm institutional or large-scale participation.
- If the price retests $82.86, watch for a failure of the institutional floor, which would signal a shift back to the lower end of the established range.
- Avoid setting rigid profit targets based on historical patterns; instead, adjust your risk management as the price approaches the $97 psychological barrier.
Watchlist for tomorrow
- Monitor the $82.86 to $88.00 range for any signs of volume-backed expansion.
- Watch for potential volatility spikes without clear directional conviction; these are often traps set to liquidate over-leveraged participants.
- Keep an eye on how the broader market reacts to the $97 threshold; if we see a rejection, expect the range-bound narrative to persist into the next cycle.
Remember: Memecoin narratives shift within hours. A breakout that looks certain at 10:00 AM can be completely retraced by 4:00 PM. Stay skeptical of your own bias and watch the volume, not just the price.
Related posts in Trading Psychology & Journaling
- Trading Psychology & Journaling
MemeLogs Daily Recap: Decoding Market Themes and Risk Management for 2026
Analyze today's memecoin market themes, compare volume against social narratives, and learn to spot caution flags in your daily trading journal routine.
Memelogs
- Trading Psychology & Journaling
Solana Memecoin Trends 2026: Navigating the Shift in Market Sentiment
Analyze today's dominant Solana memecoin themes. We break down the gap between social media hype and on-chain volume to help you track market movements.
Memelogs
- Trading Psychology & Journaling
Solana Memecoin Pulse: Navigating the 2026 Shift in Market Sentiment
Tracking the Solana memecoin landscape in 2026. We analyze the current dominance of AI-driven tokens and community-led assets versus on-chain volume data.