
Narrative Heat Map: Decoding Solana On-Chain Volume Trends in 2026
Analyze today's Solana memecoin narratives against real-time on-chain liquidity heat maps. Learn to spot volume discrepancies before you commit capital.

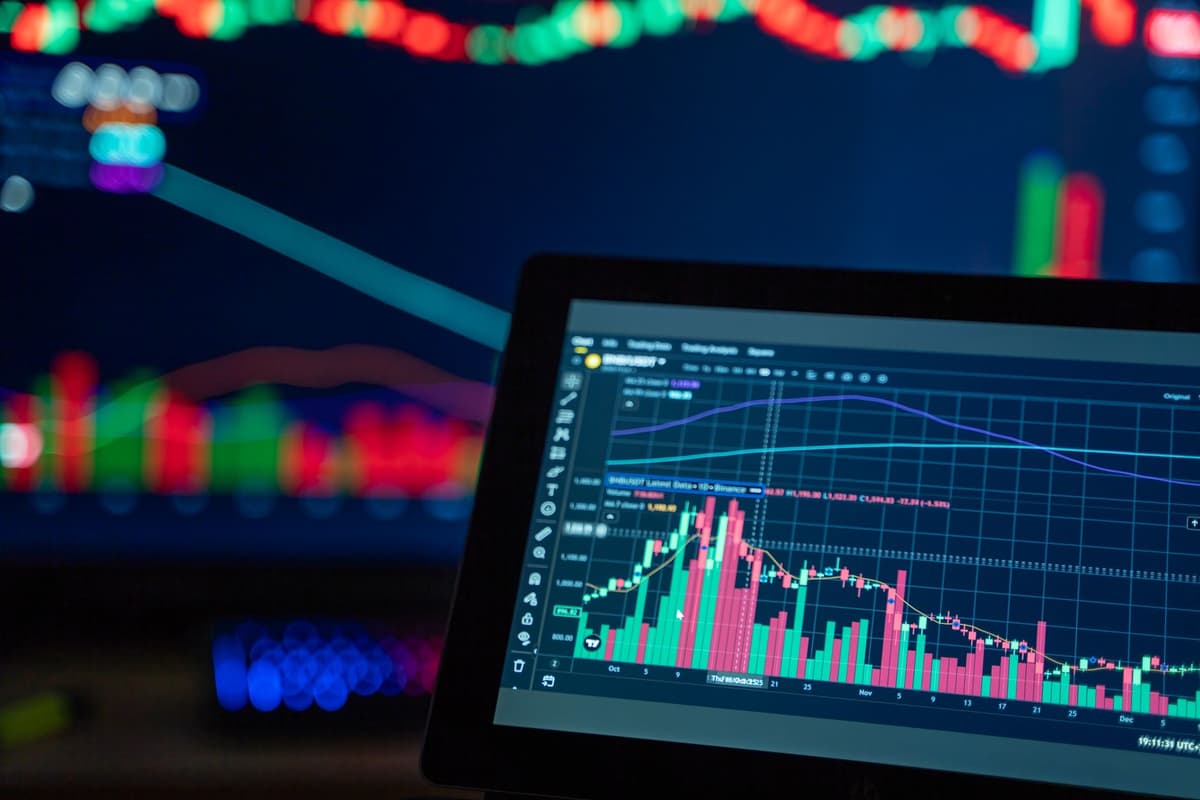
Today's market behavior is defined by a sharp divergence between social sentiment and on-chain liquidity density. While narrative-driven memecoins are seeing high social mentions, the liquidation heat maps reveal that retail participants are currently over-leveraged at key resistance levels, suggesting that today's volume is largely reactive rather than conviction-based.
The Narrative vs.
The Reality
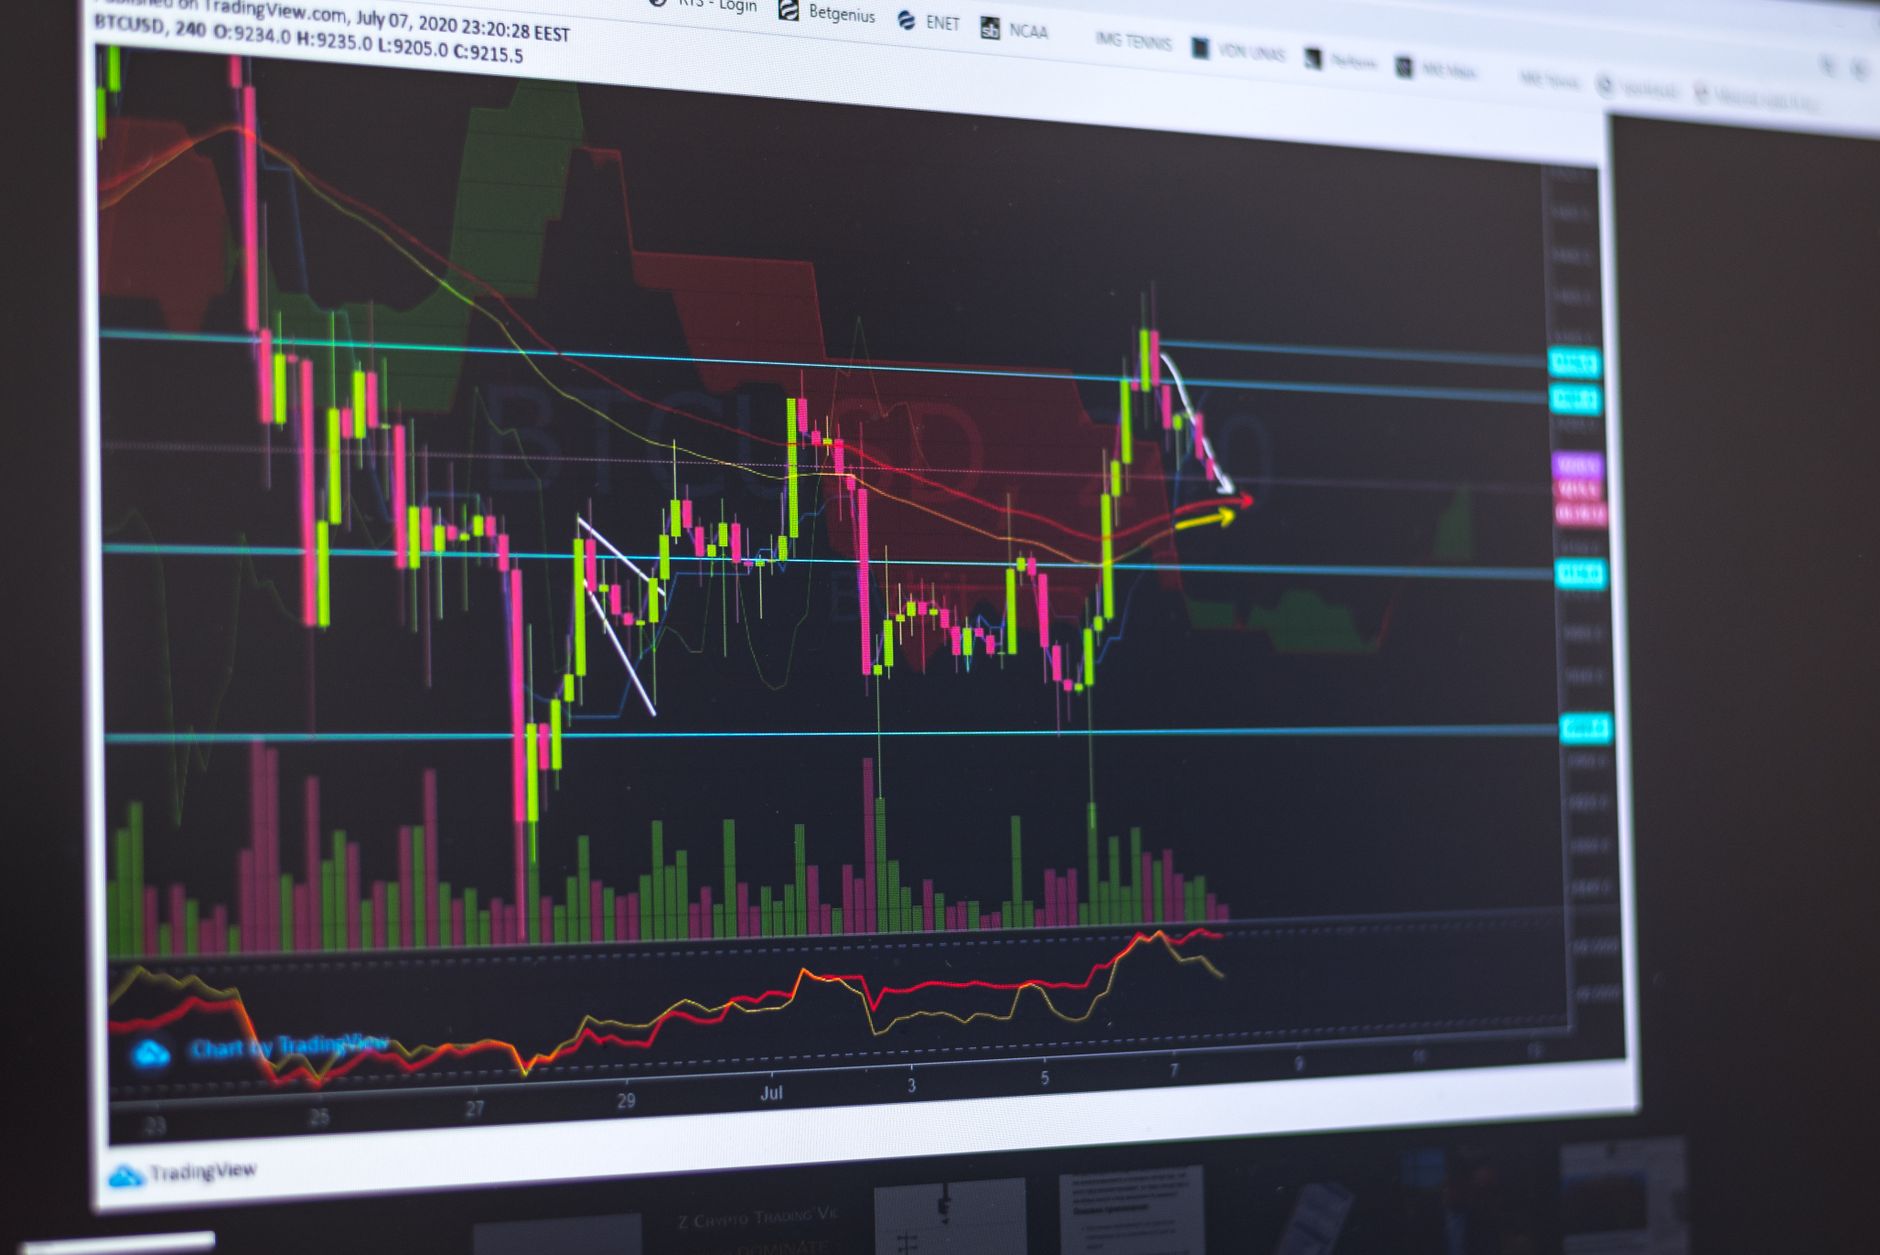
Today, the Solana ecosystem is being dominated by two primary themes: the resurgence of legacy AI-agent tokens and the sudden, aggressive rotation into high-velocity community tokens. Social feeds are currently flooded with "super-cycle" rhetoric, suggesting that the current momentum is sustainable and poised for a breakout.
However, when we pull back the curtain and look at the real-time liquidity heat maps, the story changes. The volume we are seeing on-chain doesn't match the social intensity. We are observing high-frequency "churn"—where volume is being driven by bots and scalpers reacting to liquidation clusters rather than genuine long-term accumulation. When the heatmap shows a "bright" zone of concentrated liquidation levels, it is rarely a sign of support. Instead, it acts as a magnet for price discovery, often leading to rapid cascades that wipe out the very retail participants who believed the narrative hype.
Why Volume Dots Matter More Than Price
In 2026, relying on price action alone is a losing game. The market is too fast, and retail participants are often the last to see the true order flow. By looking at raw volume data and depth-of-market visualization, we can see where the actual money is sitting. If a token is trending on social media but the volume dots on the heatmap are sparse or non-existent, the narrative is likely manufactured.
True market strength is confirmed when volume clusters align with liquidity support. If you see a massive spike in volume but the price fails to break past a known liquidation level, it is a clear indicator that institutional or whale-level participants are absorbing the retail demand. This is the moment to exercise extreme skepticism.
The Psychology of the Heatmap
Trading psychology in 2026 is fundamentally tied to how we interpret color-coded data. A bright, "hot" zone on a liquidation map triggers a fear-of-missing-out (FOMO) response, but seasoned market participants see these zones as areas of potential volatility. The heatmap is not a crystal ball; it is a gauge of where the pain threshold resides. When you journal your trades, you should be documenting not just your entry and exit, but whether the heatmap confirmed your bias or contradicted it. If you entered a trade based on a narrative, but the heatmap showed high liquidation risks nearby, your journal should reflect a failed risk-management process, regardless of the outcome.
1. Analyze the narrative sentiment across primary social channels
2. Cross-reference the ticker against real-time on-chain liquidity levels
3. Identify the nearest liquidation cluster to gauge potential downside risk
4. Observe volume dots to confirm if retail liquidity is actually entering the asset
5. Document the discrepancy between the narrative and the data in your daily journal
FAQ
Is it possible for a memecoin narrative to hold up even when the heatmap shows high liquidation risk?
Yes, but it is rare and usually signifies a "liquidity hunt" phase. In such cases, the price may dip sharply to trigger liquidations and flush out over-leveraged participants before continuing its upward move. This is high-risk volatility that requires precise timing.
How can I tell if the volume I see is organic or manufactured?
Look for consistency in the volume dots. Organic volume tends to show steady, distributed activity across multiple price levels, whereas manufactured volume often appears as sharp, singular spikes that do not translate into sustained price movement or structural support on the heatmap.
Watchlist for Tomorrow
Keep a close eye on the established AI-agent tokens and the recent community rotation plays. Do not look for specific price targets. Instead, monitor the liquidity clusters on the heatmap. If the narrative continues to build but the liquidity zones remain stagnant, we are likely looking at a exhaustion pattern. If the heatmap begins to show new, stable support levels forming beneath the current price, that is the only signal worth noting. Stay skeptical, keep your journal updated, and prioritize data over the noise.
Related posts in Trading Psychology & Journaling
- Trading Psychology & Journaling
MemeLogs Daily Recap: Decoding Market Themes and Risk Management for 2026
Analyze today's memecoin market themes, compare volume against social narratives, and learn to spot caution flags in your daily trading journal routine.
Memelogs
- Trading Psychology & Journaling
Solana Memecoin Trends 2026: Navigating the Shift in Market Sentiment
Analyze today's dominant Solana memecoin themes. We break down the gap between social media hype and on-chain volume to help you track market movements.
Memelogs
- Trading Psychology & Journaling
Solana Memecoin Pulse: Navigating the 2026 Shift in Market Sentiment
Tracking the Solana memecoin landscape in 2026. We analyze the current dominance of AI-driven tokens and community-led assets versus on-chain volume data.