
Narrative Heat Map: Analyzing Solana On-Chain Volume Trends in 2026
Decode today's Solana memecoin narratives by cross-referencing social sentiment with real-time on-chain volume and liquidation heatmaps. Stay ahead in 2026.


Today's market is defined by a clash between AI-agent narratives and rapid-fire liquidity rotation. By comparing real-time on-chain volume heatmaps against social sentiment, participants can identify whether a pump is backed by genuine capital flow or merely algorithmic noise.
The Narrative Landscape
Today, the memecoin ecosystem is dominated by two primary themes: the rise of autonomous AI-agent coins and the persistent "low-float, high-FDV" re-testing cycle. Social sentiment across various platforms suggests a massive rotation into AI-linked tokens, with participants betting on the integration of on-chain agent wallets.
However, the narrative heat map tells a different story. While social engagement is peaking for new AI-branded launches, the on-chain volume data indicates that liquidity is actually flowing out of these high-velocity assets and back into established, high-market-cap Solana staples. This contradiction is a classic 2026 trap: the loudest narrative is often the one where the institutional players are looking to exit their positions into retail enthusiasm.
On-Chain Confirmation vs.
Contradiction
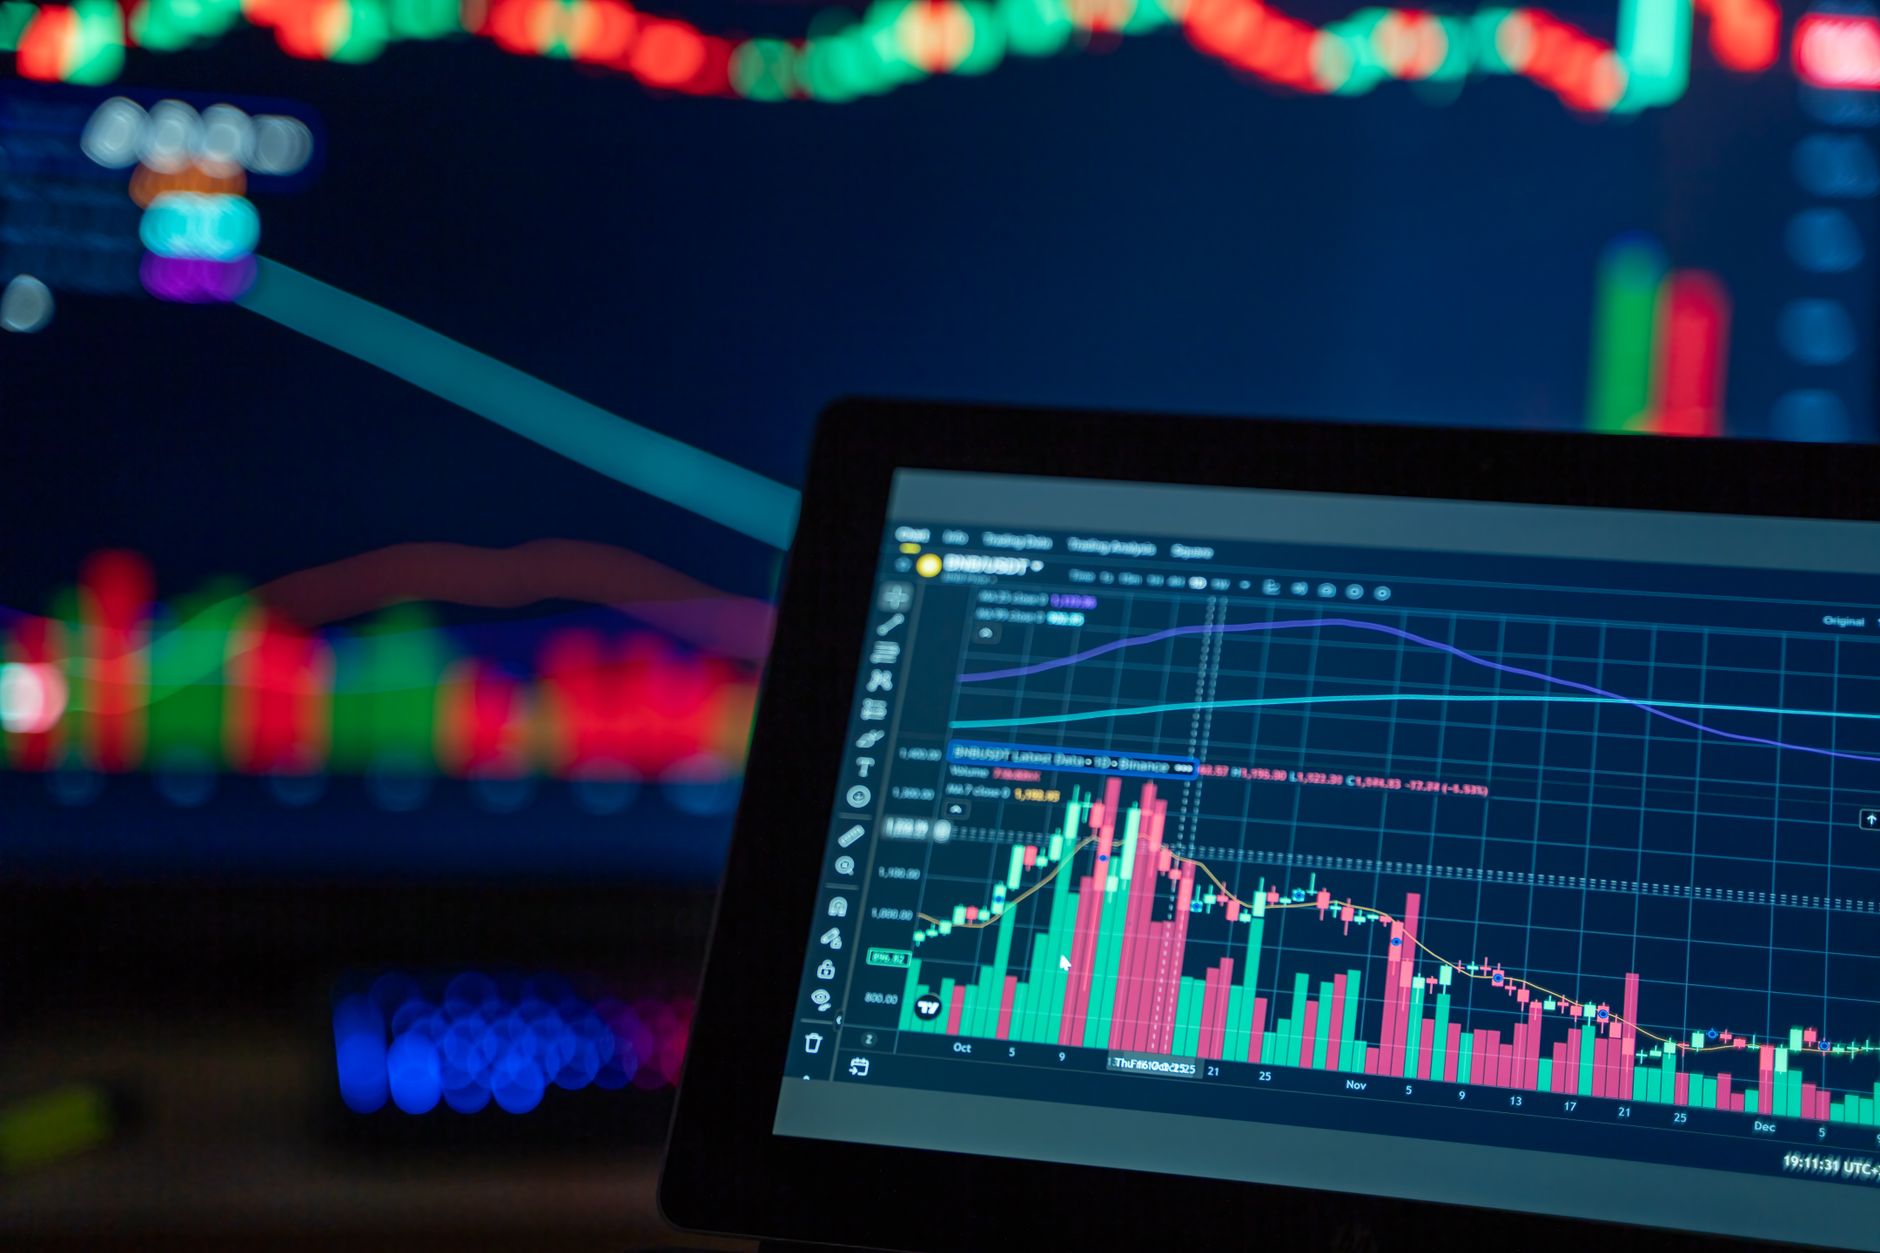
In 2026, relying on price action alone is a losing strategy. The integration of liquidation heatmaps allows us to see exactly where the market is over-leveraged. When we overlay these liquidation zones with current volume spikes, we often find that the "breakout" candles being touted on social media are actually just liquidity sweeps.
- When volume spikes occur without a corresponding increase in unique wallet activity, the move is likely driven by wash trading or bot-driven market making.
- Significant liquidation clusters forming on the downside suggest that the current "hype" is built on a house of cards, with participants holding high leverage expecting a continuation that may not materialize.
- Real-time heatmaps provide the necessary depth to confirm if a price move is supported by sustained on-chain accumulation or if it is a flash-in-the-pan event designed to trigger stop-losses.
Journaling the Heat
Successful market participants in 2026 treat their journaling as a data-science exercise. It is not enough to record the entry and exit price; you must record the state of the liquidation heatmap at the time of the trade. If you entered a long position while the heatmap showed massive liquidation levels just below the current price, you were trading against a structural probability, not with it.
1. Analyze the Daily Volume Heatmap
Check if the volume is concentrated in a specific asset category or if it is broadly distributed across the Solana ecosystem.
2. Visualize Liquidation Zones
Use real-time liquidation data to identify "pressure points" where large-scale force-closures are likely to occur.
3. Cross-Reference with Narrative Velocity
Assess whether the current social sentiment is accelerating or decelerating relative to the on-chain volume growth.
FAQ
How does a liquidation heatmap differ from standard volume indicators?
Standard volume shows what has already happened, whereas a liquidation heatmap visualizes where leveraged positions are vulnerable to being force-closed in the future, providing a map of potential volatility clusters.
Why do narratives often contradict on-chain volume?
Narratives are driven by social sentiment and psychological bias, which often move faster than capital. On-chain volume reflects the actual movement of assets, which is frequently used by smart money to harvest liquidity from those following the latest social media trends.
Watchlist for Tomorrow
Keep a close watch on assets where the volume-to-market-cap ratio is shifting significantly, even if the price remains stagnant. These assets are often preparing for a move, either as a result of institutional accumulation or a final distribution phase. Avoid chasing the coins with the highest 24-hour percentage change; instead, focus on those where the liquidation heatmaps show a clearing of leveraged positions, as these offer the most stable setups for the coming session.
Related posts in Trading Psychology & Journaling
- Trading Psychology & Journaling
MemeLogs Daily Recap: Decoding Market Themes and Risk Management for 2026
Analyze today's memecoin market themes, compare volume against social narratives, and learn to spot caution flags in your daily trading journal routine.
Memelogs
- Trading Psychology & Journaling
Solana Memecoin Trends 2026: Navigating the Shift in Market Sentiment
Analyze today's dominant Solana memecoin themes. We break down the gap between social media hype and on-chain volume to help you track market movements.
Memelogs
- Trading Psychology & Journaling
Solana Memecoin Pulse: Navigating the 2026 Shift in Market Sentiment
Tracking the Solana memecoin landscape in 2026. We analyze the current dominance of AI-driven tokens and community-led assets versus on-chain volume data.