
Reading Bonding Curve Metrics: A Guide to Solana Memecoin Dynamics in 2026
Master the art of reading on-chain bonding curve metrics. Learn how to track liquidity, holder concentration, and migration patterns before a token moves.

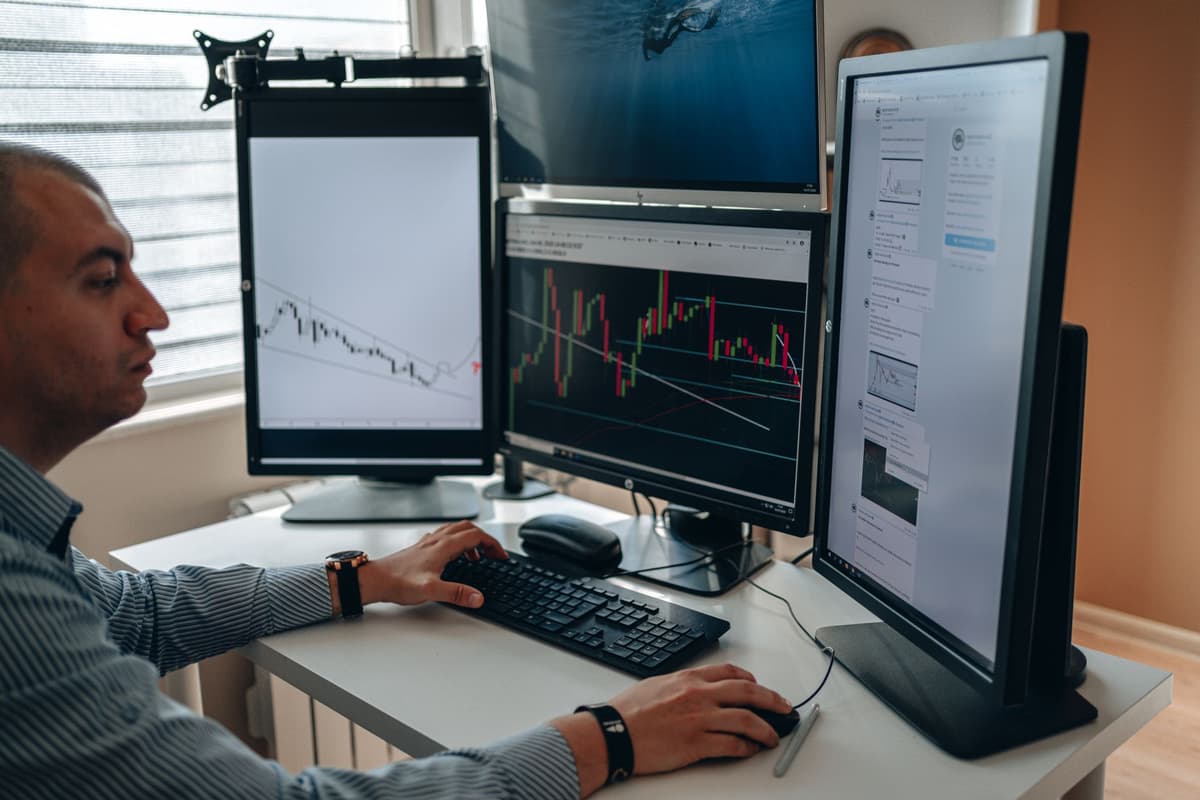
Bonding curve metrics provide a deterministic view of price action based on supply levels, allowing market participants to evaluate the risk of a token before it migrates to a decentralized exchange. By monitoring the progression of the curve, volume spikes, and wallet distribution, one can identify the transition points where a project moves from a programmed mechanism to a liquidity-backed asset.
Understanding the Bonding Curve Mechanics
On the Solana ecosystem, a bonding curve acts as a pricing engine rather than a traditional order book. It operates on a mathematical formula where the price is a function of the cumulative quantity sold. Because the price is deterministic and monotonically non-decreasing, the cost to purchase a token increases as the supply decreases on the curve.
When a token reaches the end of its bonding curve, it undergoes "migration." This is the critical juncture where the accumulated liquidity is moved to a decentralized exchange like Raydium. Understanding this transition is essential for any market participant, as it shifts the pricing model from a fixed curve to a dynamic liquidity pool where slippage is determined by the depth of the pool rather than the curve's math.
Key Metrics to Track
1. Analyze the Bonding Progress
Monitor how close the token is to the migration threshold. Tokens that are nearing the end of the curve often see increased volume as participants anticipate the transition to a standard liquidity pool. Always verify the percentage completed on the launchpad interface.
2. Evaluate Holder Concentration
Use a block explorer to inspect the top 10 to 50 holders. If a small cluster of wallets holds a significant percentage of the supply, the risk of a coordinated sell-off upon migration is high. Healthy distribution suggests a wider base of participants, which can support more stable price discovery after the liquidity pool is created.
3. Monitor Volume vs.
Price Impact
On the bonding curve, volume directly correlates with price movement. Observe the size of buy orders relative to the remaining tokens in the current tier. Large buys that push a token through multiple tiers significantly impact the price, whereas smaller, consistent volume indicates organic interest.
4. Assess Liquidity Pool Depth
Once a token migrates, the initial liquidity pool depth is the primary determinant of price stability. A shallow pool means that even small transactions can cause high slippage. Always check the total value locked in the liquidity pool before engaging with a migrated token.
The Reality of Market Movements
It is a common misconception that low unit prices imply a bargain. In 2026, market participants must look beyond the ticker price. Evaluate the market capitalization, fully diluted valuation, and 24-hour trading volume. If a token has a high circulating supply but low trading volume, it is often more susceptible to manipulation.
Furthermore, recognize that most tokens launched on a bonding curve do not survive the migration process. The curve is a high-risk environment. Many projects lose the majority of their value within days of launch. Success in this space requires separating legitimate interest from thin, manipulated volume.

FAQ
What happens when a token completes its bonding curve?
The token stops trading on the launchpad's internal curve and is migrated to a decentralized exchange. The accumulated liquidity is used to create a new liquidity pool, and the token begins trading via a standard order book or automated market maker model.
Why does slippage change after migration?
Before migration, slippage is predictable because the price is set by a fixed mathematical curve. After migration, the price is determined by the ratio of tokens to the quote asset in the liquidity pool. If the pool is small, large buy or sell orders will cause significant price impact, increasing slippage for the participant.
What this is NOT
This content is not financial advice, nor is it a buy signal for any specific asset. All analysis provided is for educational purposes regarding on-chain mechanics and market structure.
Related posts in On-Chain & Whale Tracking
- On-Chain & Whale Tracking
Decoding Bonding Curve Metrics: A 2026 Guide to On-Chain Memecoin Analysis
Master the art of reading bonding curve metrics on Solana. Learn to identify whale accumulation, liquidity health, and migration readiness before price moves.
Memelogs
- On-Chain & Whale Tracking
Decoding Bonding Curve Metrics: A 2026 Guide to Solana Memecoin Analysis
Master the art of reading bonding curve metrics before a memecoin moves. Learn how to track whale activity, liquidity shifts, and migration risks on Solana.
Memelogs
- On-Chain & Whale Tracking
On-Chain Red Flags: How to Spot Solana Rugpulls in 2026
Learn to identify common Solana rugpull patterns in 2026. Master on-chain checks for liquidity, wallet concentration, and contract risks before you participate.
Memelogs