
Narrative Heat Map: Analyzing 2026 Solana On-Chain Volume Trends
Decode today's Solana memecoin volatility using on-chain volume heatmaps. Learn how to contrast social narratives with real-time liquidity and flow.

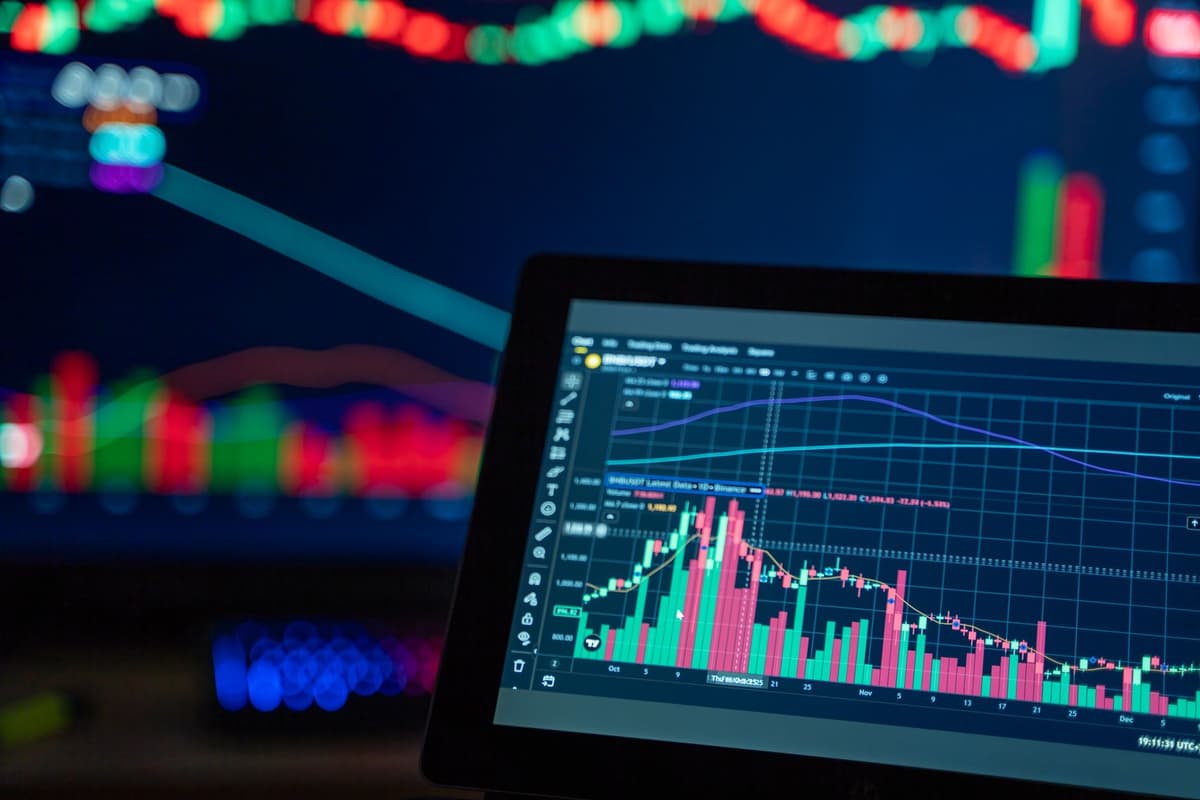
On-chain volume heatmaps for 2026 provide a visual bridge between speculative social narratives and actual liquidity shifts on Solana. By contrasting real-time order book depth with trending topics, market participants can better distinguish between genuine whale accumulation and transient retail hype cycles that often reverse within hours.
The Narrative vs.
The Reality
Today’s market activity is defined by two dominant themes: the resurgence of high-velocity meme infrastructure and the persistent rotation into utility-lite governance tokens. Social sentiment is currently heavily weighted toward the idea that Solana is entering a new phase of institutional-grade liquidity, driven by aggressive whale accumulation patterns seen in the early hours of the session.
However, when we look at the on-chain volume heatmaps, the narrative of "institutional stability" starts to crack. While headlines suggest a sustained trend, the visual data shows that much of the volume is concentrated in high-frequency, short-lived clusters. This suggests that the current movement is not necessarily a long-term position build, but rather a series of rapid liquidity grabs. The heatmap reveals that liquidity is fragmented across a wider array of low-cap assets than the social narrative would lead you to believe.
Dissecting Order Flow
When the heatmap shows a thick layer of liquidity sitting far above the current market price, it is often a sign of a looming "liquidity trap" rather than a breakout. Today, we observed that while social sentiment was bullish, the order books lacked the depth required to sustain those levels. This contradiction is a classic sign of a market that is over-extended on sentiment but under-supported by actual capital flow.
Sophisticated market participants are using these visual tools to identify where the "big money" is actually placing limit orders versus where they are merely spoofing the market. In 2026, the quality of data feeds has become the primary differentiator for this analysis. Relying on headline pricing alone is a recipe for being caught on the wrong side of a mid-day reversal.
1. Analyze Order Book Depth
Look for clusters of volume that persist across multiple time frames on your heatmap.
2. Cross-Reference Sentiment
Compare the concentration of volume with the current trending tags on social platforms.
3. Identify Divergence
If volume is increasing but the heatmap shows liquidity moving away from the current price, prepare for a volatility spike or a trend reversal.
FAQ
How does a heatmap help differentiate between real buying pressure and retail noise?
By visualizing the depth of the order book rather than just the last traded price, a heatmap allows you to see the "walls" of limit orders. Real buying pressure is characterized by persistent, thick liquidity zones that do not evaporate when the price approaches them, whereas retail noise often appears as thin, transient volume clusters that shift rapidly.
Can on-chain heatmaps predict the exact moment a narrative will flip?
No tool can predict the exact timing of a narrative shift. Heatmaps serve as a diagnostic tool to see when liquidity is drying up or shifting positions. When you see a massive liquidity wall suddenly vanish or move, it acts as a warning sign that the prevailing narrative is losing its financial backing, regardless of what the social sentiment suggests.
Watchlist for Tomorrow
As we head into the next session, the focus should remain on the stability of liquidity clusters around key support levels. Avoid chasing assets where the volume-to-market-cap ratio on the heatmap shows extreme, isolated spikes, as these often signal exhaustion. Watch for whether the current whale accumulation patterns persist or if they begin to thin out as the broader market enters a consolidation phase. Remember that memecoins are inherently volatile and today's dominant narrative can be completely invalidated by the time the next cycle of volume enters the chain.
Related posts in Trading Psychology & Journaling
- Trading Psychology & Journaling
MemeLogs Daily Recap: Decoding Market Themes and Risk Management for 2026
Analyze today's memecoin market themes, compare volume against social narratives, and learn to spot caution flags in your daily trading journal routine.
Memelogs
- Trading Psychology & Journaling
Solana Memecoin Trends 2026: Navigating the Shift in Market Sentiment
Analyze today's dominant Solana memecoin themes. We break down the gap between social media hype and on-chain volume to help you track market movements.
Memelogs
- Trading Psychology & Journaling
Solana Memecoin Pulse: Navigating the 2026 Shift in Market Sentiment
Tracking the Solana memecoin landscape in 2026. We analyze the current dominance of AI-driven tokens and community-led assets versus on-chain volume data.